Guides
Relative Strength vs. RSI: The Difference, Formulas, and Proper Use
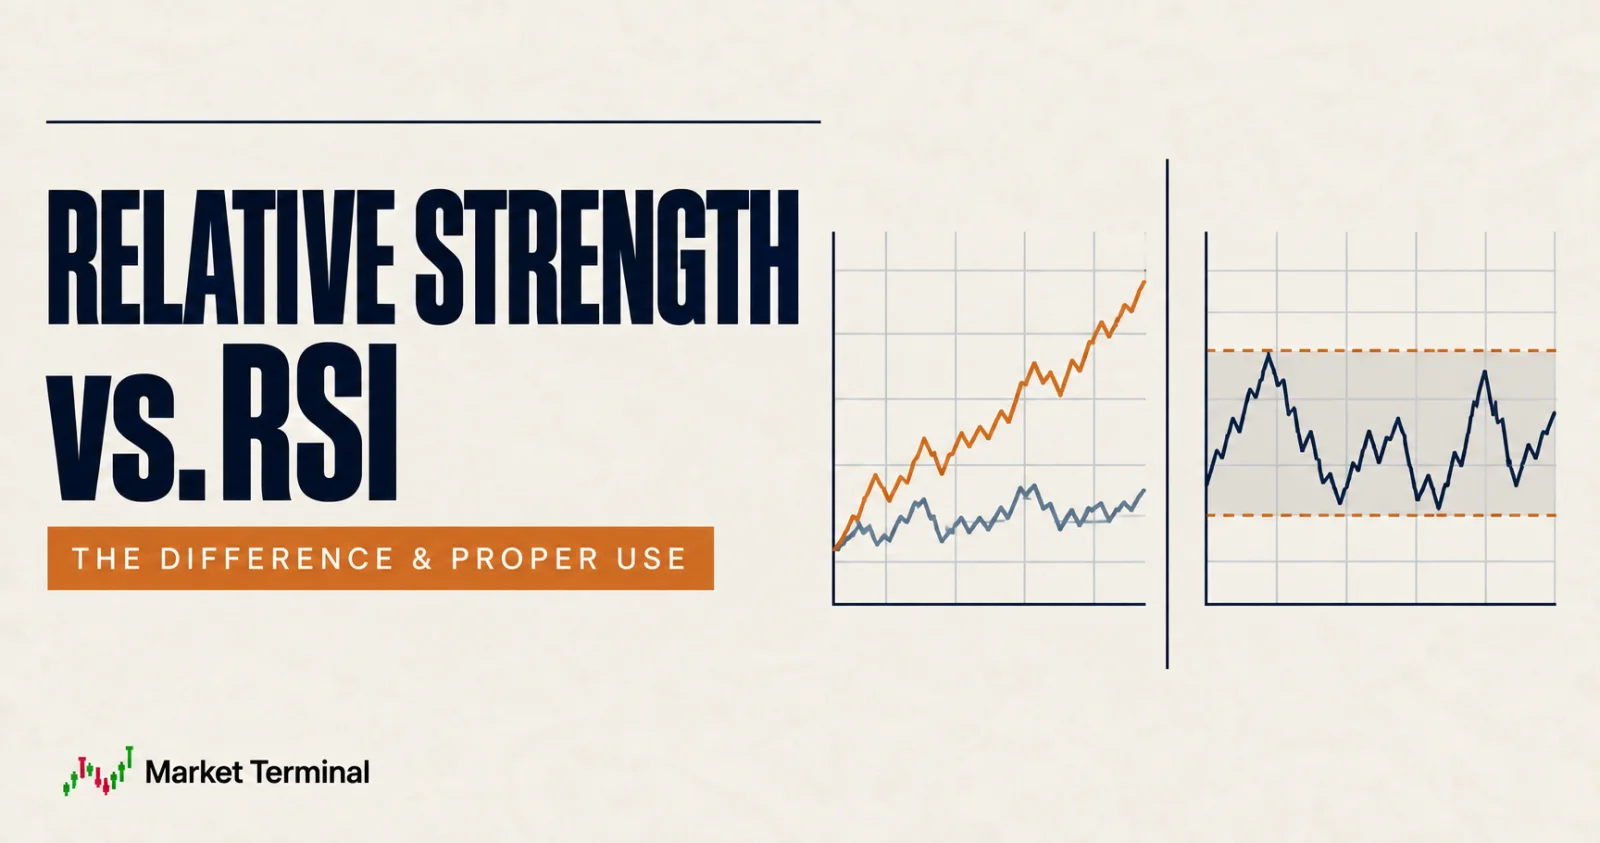
Relative strength and the Relative Strength Index (RSI) sound interchangeable. They are not.
Relative strength compares one asset’s performance with another asset or benchmark. Wilder’s RSI measures the balance of one asset’s recent gains and losses on a bounded 0–100 scale. The two indicators use different inputs, formulas, scales, and interpretations.
Confusing them can reverse the meaning of a chart. A stock can outperform its benchmark while its own price falls, and it can have a high RSI while underperforming the benchmark. This guide defines both measures precisely and shows how to use them without treating either as a forecast.
Build an RSI-and-performance research list in Market Terminal. Filter stocks by RSI and fixed-horizon performance in the Stock Screener, then compare candidates with their sector and a relevant benchmark before drawing a conclusion. Open the Stock Screener →
Educational scope: Hypothetical examples omit taxes, fees, spreads, and other investor-specific factors. No indicator discussed here is a recommendation to buy, sell, or time a security.
Table of contents
- Relative strength vs. RSI at a glance
- What is relative strength?
- What is Wilder’s RSI?
- Worked examples: step-by-step calculations
- How to use both indicators together
- A practical analysis workflow
- Limitations and false signals
- Relative strength and RSI checklist
- Frequently asked questions
Relative strength vs. RSI at a glance
| Feature | Relative strength (comparative performance) | Relative Strength Index (Wilder’s RSI) |
|---|---|---|
| Core question | Is asset A outperforming asset B? | How strong are asset A’s recent gains versus recent losses? |
| Inputs | Two compatible price or total-return series | One asset’s sequential prices |
| Basic form | Asset series divided by benchmark series | Smoothed average gain divided by smoothed average loss, transformed to 0–100 |
| Scale | Unbounded ratio or rebased index | Bounded from 0 to 100 |
| Direction | Rising means relative outperformance | Higher means recent gains dominate recent losses |
| Benchmark required? | Yes | No |
| Typical ambiguity | Also called a price ratio or relative-strength comparison | “Relative strength” in the name is not cross-asset comparison |
Fidelity’s technical-indicator documentation makes the distinction explicit. Its Relative Strength Comparison divides one security’s price by a base security or index. Its RSI guide describes J. Welles Wilder’s RSI as a momentum oscillator based on the speed and change of one price series.
What is relative strength?
In comparative analysis, relative strength is the performance of one security, sector, or portfolio relative to a chosen benchmark. It appears in two closely related forms.
The relative-strength ratio line
Let be the adjusted price or total-return index for the asset and the compatible series for the benchmark:
If the line rises, the asset is outperforming the benchmark over that interval. If it falls, the asset is underperforming. If it is flat, their percentage changes are equal over the interval.
The numerical level usually has no standalone meaning. Analysts often rebase the line to 100 at a starting date:
A reading of 105 then means the asset-to-benchmark ratio has increased 5% from the base date—not that the asset itself returned 5%.
Holding-period change in the relative-strength ratio
For asset return and benchmark return :
This is the percentage change in the asset-to-benchmark ratio over the holding period. Some analysts instead report arithmetic active or excess return, . That is a percentage-point difference and a distinct convention—not an error or the same output. Label the measure used.
Cross-sectional relative strength
Some research ranks many securities by trailing returns or benchmark-relative returns and calls the rank “relative strength.” That is still comparative performance, but it is not the same output as a two-series ratio line. Under a higher-is-stronger percentile convention, a rank of 90 means the security ranked above most members of the defined universe during the chosen period. It is not an RSI of 90.
Data choices that change the answer
Relative strength is only as coherent as its inputs:
- Use adjusted prices or total-return indices for both series.
- Align dates, closing times, currencies, and market holidays.
- Choose a benchmark that matches the question.
- State the lookback and rebasing date.
- Avoid mixing a price-only asset series with a total-return benchmark.
A U.S. industry fund versus a broad U.S. index asks whether that industry exposure outperformed the market. The same fund versus a global index asks a different question. Neither benchmark is neutral.
What is Wilder’s RSI?
The Relative Strength Index is a bounded momentum oscillator that compares the smoothed magnitude of one asset’s recent gains with its recent losses. Wilder presented it in his 1978 book New Concepts in Technical Trading Systems, commonly with a 14-period lookback (Google Books catalog record). “Period” can mean days, weeks, hours, or another bar interval; a 14-day RSI and a 14-week RSI are different indicators.
For closing price , define the change, gain, and loss:
Loss is recorded as a positive magnitude. For lookback , seed the first averages with simple means:
For later observations, apply Wilder smoothing:
Then:
Notice that the inside RSI is average gain divided by average loss for one asset. It is not the asset/benchmark ratio used in comparative relative strength. TA-Lib’s indicator documentation publishes the same Wilder seed, recursive smoothing, RS, and RSI equations (TA-Lib RSI documentation).
If average loss is zero while average gain is positive, RSI is conventionally 100. If average gain is zero while average loss is positive, RSI is 0. If both averages are zero, the formula is and is mathematically undefined; software implementations must choose an edge-case convention. Check and document the platform implementation.
Traditional commentary often labels RSI above 70 “overbought” and below 30 “oversold.” These are conventions, not valuation statements or automatic signals. Fidelity notes that RSI can remain overbought or oversold for extended periods during strong trends and that levels may need adjustment for the security being studied (Fidelity RSI guide).
Worked examples: step-by-step calculations
Relative-strength example
Assume an asset’s total-return index rises from 100 to 112 while its benchmark rises from 200 to 216.
The ratio moves from:
to:
The rebased ratio ends at:
The change in the relative-strength ratio is:
The asset returned 12%, the benchmark returned 8%, and the ratio-based relative performance was 3.70%. The arithmetic active return was 4 percentage points. Both descriptions can be valid, but they are not the same calculation.
Now suppose both fall: the asset drops 6% while the benchmark drops 10%. The ratio change is , while the arithmetic active return is 4 percentage points. Relative strength improved even though the asset lost money. Always report absolute and relative outcomes together.
Wilder RSI example
Use a short five-period window only to keep the arithmetic visible. Assume closes of 100, 102, 101, 104, 103, and 105. The five changes are +2, -1, +3, -1, and +2.
- Gains: 2, 0, 3, 0, 2; average gain = .
- Losses: 0, 1, 0, 1, 0; average loss = .
- .
- .
If the next close is 104, the new change is -1. Wilder’s smoothed averages become:
The new RS is 2.1538 and RSI is approximately 68.29. The example says recent upward changes outweighed downward changes under this five-period calculation. It says nothing directly about benchmark performance or fair value.
How to use both indicators together
The indicators are complementary because they answer separate questions. A simple four-state framework prevents the names from blending together:
| Comparative relative-strength line | RSI state | Careful description |
|---|---|---|
| Rising | High | Outperforming benchmark with strong recent internal momentum |
| Rising | Low or recovering | Outperforming over the comparison window despite weak or improving short-term momentum |
| Falling | High | Strong recent gains, but weaker than the benchmark over the comparison window |
| Falling | Low | Underperforming benchmark with weak recent internal momentum |
“High” and “low” should be defined in the research plan. This table does not assign a trade. For example, a rising relative line with RSI above 70 is not proof that a security is overpriced; RSI uses price changes, not earnings, cash flow, or valuation.
Time horizons can also conflict legitimately. A stock can have a rising 12-month relative-strength line and a falling 14-day RSI because it is undergoing a short pullback within longer-term outperformance. Label each horizon.
A practical analysis workflow
1. Start with the question
Use comparative relative strength for “Which asset performed better?” Use RSI for “How have recent gains compared with recent losses in this asset?” If the question concerns value, quality, or financial health, neither indicator answers it.
2. Set the data contract
Record symbol, benchmark, adjusted-price or total-return convention, currency, bar interval, close time, lookback, and as-of date. Confirm how the platform handles splits, distributions, missing bars, and RSI seeding.
3. Calculate absolute performance first
Show the asset and benchmark returns before their ratio. This prevents “relative strength” from being mistaken for a positive return.
4. Examine comparative strength across defined horizons
Use, for example, 1-, 3-, 6-, and 12-month ratio changes, arithmetic active returns, or a ratio chart. Avoid selecting whichever window produces the preferred conclusion. Cross-sectional ranks must state the universe and whether ranks are sector-neutral.
5. Calculate RSI consistently
Specify “14-period Wilder RSI on daily adjusted closes,” not merely “RSI.” Some platforms use different seeding, rounding, price inputs, or a simple-average variant often called Cutler’s RSI. Small differences can persist, especially with limited history.
6. Add context and independent evidence
Review volume, volatility, market breadth, sector behavior, earnings, balance-sheet data, valuation, and company filings as relevant. Technical measures summarize price history; they do not explain why a move occurred.
7. Write a falsifiable observation
An appropriate note is: “The 3-month total-return ratio versus the benchmark rose 4%; 14-day Wilder RSI was 72 at the close.” An inappropriate leap is: “The stock must keep rising.” FINRA warns that momentum indicators can give false signals in volatile markets and that even sophisticated methods cannot predict unexpected shocks (FINRA, Momentum Investing).
Limitations and false signals
Relative strength limitations
- Benchmark dependence: changing the benchmark can change the conclusion.
- Dividend mismatch: price and total-return series can point in different directions.
- Currency effects: unhedged cross-country comparisons mix asset and foreign-exchange returns.
- Survivorship bias: current-universe rankings can omit delisted securities.
- Concentration: benchmark performance may be driven by a few large constituents.
- Lookback sensitivity: a different start date may reverse the rank.
RSI limitations
- Trend persistence: RSI can stay above 70 or below 30; an extreme is not a timer.
- Parameter sensitivity: period length and bar interval materially affect readings.
- Implementation differences: seed, smoothing, adjustment, and rounding can change values.
- Divergence failure: price-RSI divergences can persist or vanish without reversal.
- Gap sensitivity: one event-driven move can dominate a short lookback.
- No valuation information: RSI does not measure whether a security is cheap or expensive.
Both are historical transformations. The SEC reminds investors that past performance does not necessarily predict future results and recommends checking methodology, dividends, costs, and market conditions when evaluating performance (Investor.gov, Performance Claims).
Relative strength and RSI checklist
- I know whether “relative strength” means a ratio line, a ratio change, arithmetic active return, or a cross-sectional rank.
- I have not mistaken comparative relative strength for Wilder’s RSI.
- Asset and benchmark series use aligned dates, currencies, and return conventions.
- I report absolute returns alongside relative results.
- The benchmark and ranking universe match the research question.
- RSI period, bar interval, price input, seed, and smoothing method are documented.
- I verified edge-case and corporate-action handling.
- I treat 70/30 as conventions, not mandatory trade triggers.
- I use independent fundamental and risk evidence where relevant.
- My conclusion describes observed data and avoids predictions.
Frequently asked questions
Is relative strength the same as RSI?
No. Comparative relative strength uses two assets or an asset and a benchmark. RSI uses one asset’s smoothed recent gains and losses and outputs a number from 0 to 100.
How do you calculate comparative relative strength?
Divide an asset’s adjusted-price or total-return series by a compatible benchmark series. A rising ratio means the asset outperformed over that interval; a falling ratio means it underperformed. State the benchmark, dates, currency, and return convention.
Can relative strength be negative?
A price ratio is normally positive when both input series are positive. Its holding-period change can be negative when the asset underperforms. A rebased line can fall below 100 without becoming negative.
Is RSI above 70 always bearish?
No. It means gains have dominated losses under the chosen calculation. Strong trends can keep RSI elevated. It is neither a valuation measure nor an automatic reversal signal.
What benchmark should I use for relative strength?
Use one that matches the decision: a broad market for market-relative performance, a sector index for peer-relative performance, or a policy benchmark for portfolio evaluation. State it explicitly.
Why does RSI differ between charting platforms?
Platforms may differ on adjusted versus unadjusted prices, the initial seed, Wilder versus simple smoothing, rounding, session boundaries, missing bars, and the amount of history loaded.
Can I compare RSI values across stocks?
You can compare readings calculated with identical settings and timestamps, but that does not make them equivalent opportunities. Volatility, trend, gaps, liquidity, and event risk differ across securities.
Related research guides
- Stock Market Breadth: Indicators and Formulas
- Sector Rotation: A Practical Guide
- Stock Research Checklist
Sources
- J. Welles Wilder, New Concepts in Technical Trading Systems (1978): https://books.google.com/books/about/New_Concepts_in_Technical_Trading_System.html?id=WesJAQAAMAAJ
- Fidelity, Relative Strength Comparison: https://www.fidelity.com/learning-center/trading-investing/technical-analysis/technical-indicator-guide/relative-strength-comparison
- Fidelity, Relative Strength Index (RSI): https://www.fidelity.com/learning-center/trading-investing/technical-analysis/technical-indicator-guide/RSI
- TA-Lib, Relative Strength Index documentation and formula: https://ta-lib.org/functions/rsi.html
- FINRA, What Is Momentum Investing?: https://www.finra.org/investors/insights/momentum-investing
- SEC Office of Investor Education and Advocacy, Investor Bulletin: Performance Claims: https://www.investor.gov/introduction-investing/general-resources/news-alerts/alerts-bulletins/investor-bulletins-47
- Market Terminal, Stock Screener: https://marketterminal.com/stock-screener
Market Terminal Research