Guides
Stock Market Breadth: Indicators, Formulas, and a Practical Workflow
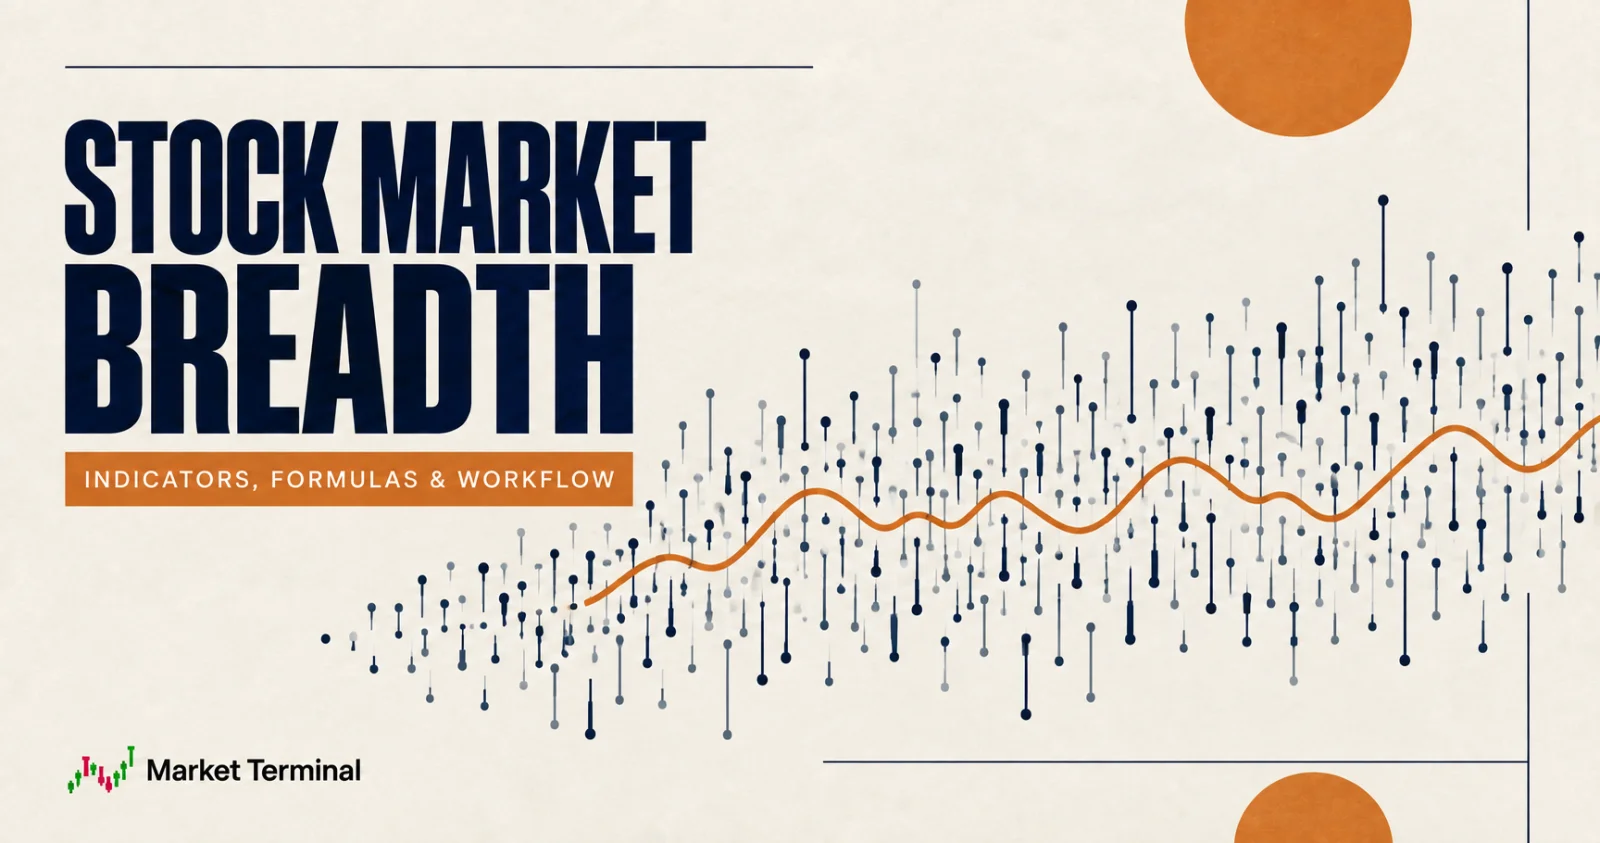
Stock market breadth measures how widely a market move is shared among securities. An index can rise because hundreds of stocks advanced or because a few large constituents carried it. The headline return is the same; the participation underneath is not.
Breadth helps investors describe that participation. It does not reveal an invisible “true market,” and a divergence is not a countdown to reversal. Reliable analysis starts with a precisely defined universe, consistent data, and several complementary measures.
Look beyond the index in Market Terminal. Use Stock Ideas to inspect breakouts, breakdowns, movers, and 52-week highs and lows across individual stocks, then compare those lists with a clearly defined market universe. Explore Stock Ideas →
Educational scope: All examples below are hypothetical. Breadth is a descriptive input, not a prediction or a recommendation to transact in any security.
Table of contents
- What is stock market breadth?
- Why index return and participation can diverge
- Market breadth indicators at a glance
- Core breadth indicators and formulas
- How to interpret breadth without overclaiming
- A practical breadth-analysis workflow
- Worked example
- Limitations and false signals
- Market breadth checklist
- Frequently asked questions
What is stock market breadth?
Stock market breadth is the degree of participation by individual securities in the movement or trend of a defined market universe. Common measures count advancing and declining issues, compare their trading volume, count new highs and lows, or calculate the percentage of constituents above a moving average.
Every breadth statement needs five pieces of metadata:
- Universe: an index, an exchange’s listed common stocks, or another fixed set.
- Eligibility: whether the set includes ADRs, funds, preferred shares, warrants, multiple share classes, or only operating-company common stocks.
- Comparison rule: today’s adjusted close versus the prior adjusted close, an intraday reference, or a moving average.
- Time: observation timestamp and trading calendar.
- Weighting: one vote per issue, trading-volume weight, or another scheme.
Without that contract, “breadth was strong” is not reproducible. Nasdaq’s own pages illustrate why eligibility details matter. Its “Most Advanced” and “Most Declined” tables use percentage price change for Nasdaq Global and Global Select Market securities, exclude warrants and units, and apply price and volume screens (Nasdaq, Most Active methodology). Those lists should not be treated as a count of every Nasdaq-listed instrument.
Why index return and participation can diverge
Many familiar equity indices give larger companies more influence. S&P Dow Jones Indices states that most of its equity indices are float-adjusted market-capitalization weighted, with each stock’s weight proportional to its float-adjusted market value (S&P DJI, Index Mathematics Methodology). Nasdaq defines a capitalization-weighted index similarly: stocks with the largest market values receive the heaviest weights (Nasdaq glossary).
Breadth usually gives each eligible issue one observation. A 1% move by the smallest member affects an advance-decline count as much as a 1% move by the largest. Therefore:
- a cap-weighted index can rise while most constituents fall;
- most stocks can rise while an index falls because its largest members declined;
- breadth can improve before an index breaks out, or deteriorate while the index continues higher;
- neither divergence requires an imminent reversal.
This is not a defect in either measure. Index return answers, “How did this weighted basket perform?” Breadth answers, “How many members participated, under this rule?”
Market breadth indicators at a glance
| Indicator | Basic calculation | Question it helps answer |
|---|---|---|
| Net advances | Advancing issues minus declining issues | Did more securities rise than fall? |
| Advance-decline line | Prior A/D line plus net advances | Is issue participation accumulating or deteriorating over time? |
| Advance percentage | Advancers divided by advancers plus decliners | What share of directionally changed issues rose? |
| Up/down-volume ratio | Volume in advancing issues divided by volume in declining issues | Was more trading volume associated with rising or falling issues? |
| New highs minus new lows | Issues at new highs minus issues at new lows | Are more securities reaching the top or bottom of a stated range? |
| Percentage above a moving average | Members above the average divided by eligible members | How widely is a trend rule being met? |
| Equal-weight versus cap-weight gap | Equal-weight return minus cap-weight return | Were returns stronger under equal weighting or capitalization weighting? |
No row is a standalone trading signal. Each calculation still requires a defined universe, timestamp, data source, and treatment of unchanged or ineligible securities.
Core breadth indicators and formulas
Let be advancing issues, declining issues, and unchanged issues on session . A conventional close-to-close calculation classifies each eligible security by comparing its adjusted closing price with the prior session’s adjusted close.
Net advances
Positive net advances mean more issues rose than fell. The magnitude depends on universe size, so 500 net advances in a 1,000-stock set is different from 500 in a 5,000-stock set.
Advance-decline line
The advance-decline line, or A/D line, cumulatively adds net advances. Its starting value is arbitrary; its direction and behavior relative to a market index are what analysts examine. Absolute levels need a common base for comparison, and rebasing still does not resolve differences between vendors’ eligible universes.
Advance-decline ratio
An ADR above 1 means advancers outnumber decliners. If , the ratio is undefined or infinite; a production system should specify an edge-case rule rather than silently substituting zero. Ratios are asymmetric: 2.0 and 0.5 are reciprocal outcomes, which can make averages unintuitive.
Advance percentage
This version excludes unchanged issues. An alternative denominator, , answers a slightly different question. Label which one you use. Advance percentage is normalized across changes in universe size and bounded between 0 and 100 when ; if no eligible issue changes, this version is undefined.
Up-volume and down-volume breadth
Let be total volume in advancing issues and total volume in declining issues:
A normalized version is:
It ranges from -100 to +100 when the denominator is positive. If , the ratio above is undefined or infinite; the normalized version is still defined if . This formulation excludes volume in unchanged issues; label any different treatment.
Volume breadth shows whether reported share volume was concentrated in advancers or decliners, but it does not by itself say total volume was unusually high. A few unusually active stocks can also dominate. Define whether off-exchange volume, auction prints, and corrected trades are included. NYSE notes that its proprietary feeds and reports cover different combinations of trades, quotes, auctions, and venues, underscoring the need to document the source (NYSE, Real-Time Market Data).
New highs and new lows
Let be issues making a new high over a stated lookback and those making a new low:
Some analysts also use when . “New high” must specify the window—52 calendar weeks, 252 trading sessions, or another period—and whether a tie counts. A security with less history than the lookback needs an explicit eligibility rule.
Percentage above a moving average
For eligible securities with price and an -period moving average :
The indicator measures participation in a trend rule. Common windows such as 50 and 200 sessions are conventions, not natural laws. Require enough valid history for each constituent and specify how missing observations are handled.
Equal-weight versus cap-weight return
The return gap between an equal-weight version and a capitalization-weighted version of the same universe is a useful participation proxy. S&P DJI says its equal-weight indices use the same constituents as the corresponding cap-weighted indices. Each company is reset to an equal weight at quarterly rebalances (S&P DJI, Equal Weight Indices).
For compatible return series over the same interval, a simple spread is:
This is a percentage-point return difference, not a constituent count. A positive value means the equal-weight version outperformed during that interval.
The gap is not pure breadth. Equal weighting also changes size exposure, turnover, and rebalancing effects. Use it alongside constituent counts, not as a substitute for them.
How to interpret breadth without overclaiming
Confirmation
If an index makes a sustained advance while the A/D line rises, the advance percentage remains mostly above 50, and new highs expand, several measures agree that participation is broad. That describes the observed move; it does not guarantee continuation.
Negative divergence
A negative breadth divergence occurs when the index reaches a higher high while a chosen breadth measure fails to confirm—for example, the A/D line makes a lower high. This can flag increasing concentration. It is not a sell signal by definition. Large stocks can continue leading long after participation narrows, and the two series may use mismatched universes.
Positive divergence
A positive divergence occurs when an index makes a lower low while breadth makes a higher low or fewer stocks register new lows. Selling pressure may be becoming less widespread, but price can keep falling and the divergence can disappear.
Thrusts and extremes
Very high advance percentages or up/down-volume ratios are sometimes called breadth thrusts; very low readings are sometimes called washouts. Thresholds vary by universe, vendor, and historical sample. A threshold chosen after inspecting the outcome is overfit. Test definitions with point-in-time constituents and out-of-sample periods before assigning significance.
A practical breadth-analysis workflow
Step 1: Define one clean universe
Choose an exchange or index and decide which security types qualify. The Nasdaq Composite methodology, for example, includes eligible domestic and international common-type stocks listed on Nasdaq while excluding ETFs, preferred stocks, rights, warrants, units, and other derivative securities (Nasdaq Composite methodology). An exchange-wide vendor feed may follow different rules.
Step 2: Validate raw data
Check symbol changes, splits, distributions, duplicate share classes, suspended securities, stale prices, missing volume, IPO history, and delistings. Compare with the expected eligible count. A sudden universe break can create an artificial jump in the A/D line.
Step 3: Build a small indicator panel
Start with one count measure, one volume measure, one trend measure, and one concentration comparison:
- advance percentage and A/D line;
- normalized up/down volume;
- percentage above the 50- and 200-session averages;
- equal-weight minus cap-weight return.
Highly similar variations add apparent complexity without much independent information.
Step 4: Use levels, trends, and persistence
Record the daily reading, a short moving average, and behavior over several weeks. One extreme session can be informative after a shock, but persistence is usually more useful for describing a trend. Never mix intraday breadth with a final closing index value.
Step 5: Compare like with like
Overlay breadth with the index representing the same constituents. If you study Nasdaq-listed breadth against a large-cap benchmark containing stocks from multiple exchanges, label the mismatch and explain why it is useful.
Step 6: Decompose the result
Break breadth down by sector, industry, size, or country. Aggregate weakness might be isolated to one large group, while a positive total can hide deterioration in economically sensitive industries.
Step 7: Log the observation, not a prophecy
Write: “The index rose 0.6%; 63% of eligible members advanced; the 10-day average rose for a third week.” Avoid: “Breadth proves the rally will continue.” The SEC cautions that past performance cannot predict how a strategy will perform in the future and recommends understanding the methodology behind performance claims (Investor.gov, Performance Claims).
Worked example
Assume a fixed 500-stock universe produces this hypothetical closing data:
- 310 advancing issues, 170 declining issues, and 20 unchanged;
- $1.4 billion of volume in advancing issues and $0.9 billion in declining issues;
- prior A/D line value of 12,450;
- 305 stocks above their 50-session moving averages.
The calculations are:
Net advances and normalized volume breadth are positive, 61% of members are above their 50-session average, and the A/D line rose by 140. Together, the calculated readings support describing that session as broadly positive. They are not enough to infer a lasting trend. The analyst should check prior readings, whether the strongest volume came from one event-driven stock, whether the index used the same 500 names, and whether the 50-day participation trend is improving.
Limitations and false signals
- Universe drift: IPOs, delistings, mergers, and eligibility changes alter counts.
- Survivorship bias: calculating history only from today’s constituents omits failed and removed companies.
- Corporate actions: unadjusted splits or distributions can misclassify advances and declines.
- Concentration: issue counts ignore economic size; volume measures can be dominated by a few names.
- Vendor disagreement: feeds can differ on security types, unchanged issues, volume, and timestamps.
- Lookback effects: moving-average and new-high measures depend on arbitrary windows.
- Divergence timing: non-confirmation can persist or resolve without a reversal.
- Intraday instability: readings can change sharply into the close and during closing auctions.
- Data mining: selecting the indicator, threshold, or start date after seeing results inflates apparent usefulness.
- Trading frictions: even a historically useful observation may not survive spreads, taxes, delay, and turnover.
Official market data are not one monolithic feed. NYSE describes separate products for order books, trades, quotes, auction imbalances, and reference data (NYSE Data Products). The SEC also publishes market-structure datasets grouped by characteristics such as market capitalization, price, volatility, and turnover (SEC Market Structure Data). For serious testing, preserve source documentation with the dataset.
Market breadth checklist
- Universe, eligible security types, exchange, and benchmark are explicit.
- Prices are corporate-action adjusted and timestamps align.
- Advancing, declining, and unchanged rules are documented.
- Total eligible counts are checked for unexpected breaks.
- I use count, volume, trend, and concentration measures.
- I compare daily readings with a persistent trend.
- The breadth universe matches—or is intentionally compared with—the index.
- Historical tests use point-in-time membership where possible.
- Divergences are observations, not automatic entry or exit signals.
- Any action is evaluated separately for risk, costs, taxes, and objectives.
Frequently asked questions
How is stock market breadth calculated?
There is no single formula. A basic daily measure is net advances: advancing issues minus declining issues. Analysts also use the percentage of issues advancing, cumulative A/D lines, up/down volume, new highs versus new lows, and the percentage of members above a moving average. Every result should name its universe and calculation rule.
What is a healthy market breadth reading?
There is no universal cutoff. A majority of members advancing and rising participation across several weeks can describe broad strength, but context, universe, trend, and corroborating measures matter more than one threshold.
Is the advance-decline line leading or lagging?
It is computed from current and past price changes, so it is not inherently forward-looking. It may diverge before an index turns, but it can also diverge for long periods or give no useful warning.
Why do NYSE and Nasdaq breadth readings disagree?
They cover different listings and business mixes, and vendors may apply different eligibility rules. Disagreement can be real information or simply a universe mismatch. Read the methodology before interpreting it.
Does a rising index with weak breadth mean a crash is coming?
No. It shows concentrated leadership under the selected measures. The condition may reverse through broader participation, a decline in the leaders, or continued narrow gains.
Which breadth indicator is best?
No single indicator dominates in every environment. A compact panel—advance percentage, A/D line, volume breadth, percentage above moving averages, and an equal-versus-cap-weight comparison—covers distinct aspects without encouraging indicator overload.
Related research guides
- Sector Rotation: A Practical Guide
- Relative Strength vs. RSI: The Difference
- How to Use a Stock Screener
Sources
- S&P Dow Jones Indices, Index Mathematics Methodology: https://www.spglobal.com/spdji/en/methodology/article/index-mathematics-methodology/
- S&P Dow Jones Indices, Equal Weight Indices: https://www.spglobal.com/spdji/en/index-family/equity/us-equity/equal-weight/
- Nasdaq, Capitalization-Weighted Index definition: https://www.nasdaq.com/glossary/c/capitalization-weighted-index
- Nasdaq, Nasdaq Composite Index Methodology: https://indexes.nasdaq.com/docs/methodology_COMP.pdf
- Nasdaq, Most Active / Advanced / Declined methodology: https://www.nasdaq.com/market-activity/most-active
- NYSE, Real-Time Market Data: https://www.nyse.com/market-data/real-time
- NYSE, Data Products: https://www.nyse.com/data-products
- U.S. Securities and Exchange Commission, Market Structure Data Downloads: https://www.sec.gov/data-research/market-structure-data
- SEC Office of Investor Education and Advocacy, Investor Bulletin: Performance Claims: https://www.investor.gov/introduction-investing/general-resources/news-alerts/alerts-bulletins/investor-bulletins-47
- Market Terminal, Stock Ideas & Alerts: https://marketterminal.com/ideas
Market Terminal Research