Guides
Analyst Price Target Changes: 4 Questions to Ask First
An analyst price target is a research analyst's estimate of what a stock could be worth at a future date, published next to a rating and a valuation method. Treat a change in that number as a prompt to read the report, not as news about the company.
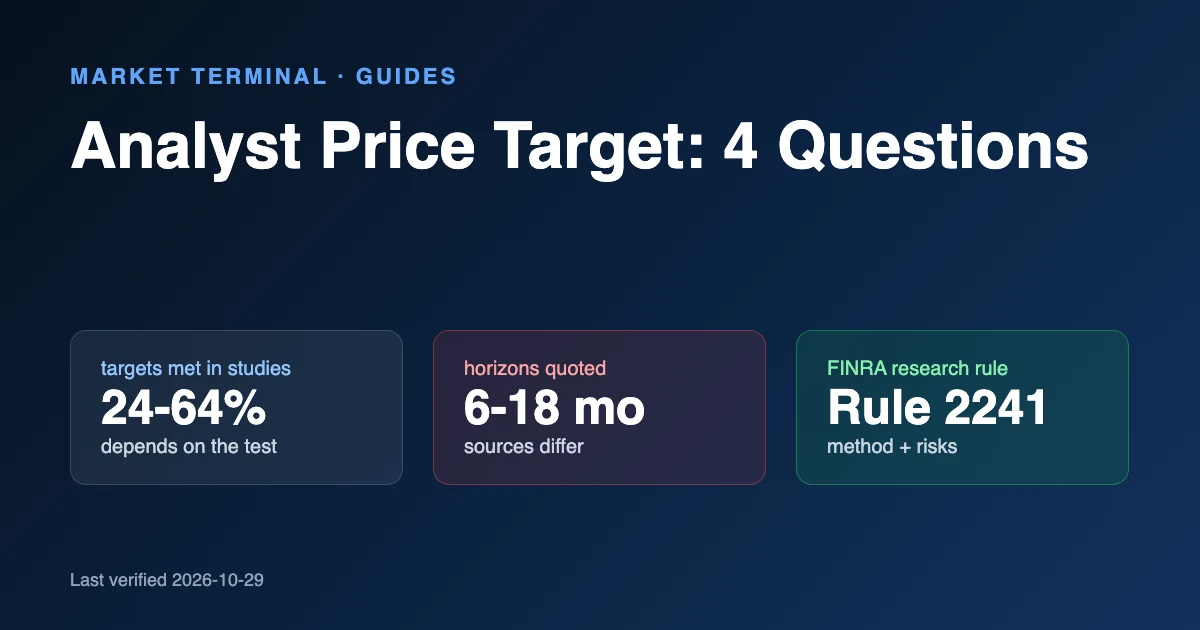
Two primary sources explain why. The SEC says a popular analyst's mention of a company can temporarily move its stock "even when nothing about the company's prospects or fundamentals has recently changed" (SEC). FINRA Rule 2241 requires member firms to have policies reasonably designed to ensure that any price target "has a reasonable basis and is accompanied by a clear explanation of any valuation method used" (FINRA).
This guide gives four questions to ask when a target is raised or cut, hypothetical arithmetic you can reproduce, and an audit of how often published studies found targets were met: from 24% to 64%, depending on the study and the test (Bradshaw and Brown; Bradshaw, Brown and Huang). A price target is an opinion about a possible future value. It is not a forecast from us and not a recommendation to buy, hold or sell anything.
Stock Summary — Everything About A Stock In One View. Panels: Price Chart, Financials, Institutional Activity, Insider Trades, Congress Activity, Analyst Ratings, MT Ratings.
Educational note: Educational content only — not investment advice. No earnings claims are being made, any results shown are not typical, and no investment advice is being given. Trading involves substantial risk of loss. Past performance does not guarantee future results. Examples are selected for education and don't represent typical results. We provide screening and charting tools and general market research, not recommendations to buy or sell any security.
How we researched this: on October 29, 2026, the Market Terminal research team read the SEC investor publication on analyst recommendations, the text of FINRA Rule 2241, two Investor.gov pages, one academic working paper in full and the abstracts of two further studies of price-target accuracy, and the Longbridge and Globe and Mail explainers cited below. The gap and valuation arithmetic is our own and hypothetical. The SEC publication was last reviewed in August 2010, and the accuracy studies cover targets issued from 1997 to 2009, so treat them as history, not as a measure of 2026 targets.
Key Takeaways
- A price target is an analyst's estimate tied to a rating, a valuation method and a time frame. The SEC notes that analysts "do not function as your financial adviser".
- Ask four questions of any change: what changed, which horizon and comparison price apply, which public facts and assumptions support it, and what the disclosures and history show.
- A target can rise while the gap to the price shrinks. In our hypothetical, a 10.0% higher target left a gap of about 1.9%, down from 25.0%.
- Published studies found 24% to 64% of targets were met, depending on the sample years and on whether "met" means at the 12-month mark or at any point in the year.
- FINRA Rule 2241 shows where the answers sit in a full report: valuation method and risks, rating definitions with the time horizon, the rating mix, a target-history chart and conflict disclosures.
Table of contents
- What is an analyst price target?
- What does it mean when an analyst raises or lowers a price target?
- What time frame does an analyst price target cover, and what price is it compared with?
- How do analysts calculate a price target, and what assumptions drive it?
- Where do you find an analyst's disclosures and target history?
- Are analyst price targets accurate?
- How do you check an analyst price target in five minutes?
- Where can you see analyst ratings next to the rest of a stock's data?
- The bottom line
- Frequently asked questions
What is an analyst price target?
An analyst price target is an analyst's estimate of a stock's value at a future date, stated in dollars. Longbridge, a brokerage, defines it as "an analyst's estimate of where a stock may trade over a stated horizon". The SEC treats analyst output as one input to a reader's own work: investors "should not rely solely on an analyst's recommendation when deciding whether to buy, hold, or sell a stock" (SEC).
Two limits follow from the SEC's guidance (SEC):
- A target is not advice for you. Analysts "do not function as your financial adviser when they make recommendations", and they are "not taking your personal circumstances into consideration".
- Rating labels vary by firm. The meanings of terms such as buy, hold and neutral "can differ from firm to firm", so the SEC tells readers to check each report's rating definitions and the firm's mix of buy, hold and sell ratings.
What does it mean when an analyst raises or lowers a price target?
Headlines tend to present a raised target as good news about the company. That reading skips a step. "Raised price target" can describe several different events, and a headline rarely says which one happened. Start from the source document, not the headline.
What should you record about a target change?
| Record | What to capture | Why it matters |
|---|---|---|
| Target | Previous and new target, currency, split adjustment | Prevents a false "increase" caused by a stock split or other corporate action |
| Rating | Prior and current rating, using the firm's definitions | Buy and hold can differ from firm to firm |
| Timing | Report date, earnings date, any material announcement | Shows whether the analyst is reacting to new information or updating late |
| Scope | Target-only change, or a full estimate and valuation revision | Identifies what drove the headline |
Match the report date to the company's earnings date. Our guide to using an earnings calendar covers that workflow.
FINRA's definition of a research report also matters here. It leaves out "notices of ratings or price target changes", provided the firm "simultaneously directs the readers of the notice to the most recent research report on the subject company that includes all current applicable disclosures" (FINRA Rule 2241). In plain terms, a short alert is a pointer. The method and the disclosures sit in the report it points to, so find that report before forming a view.
Counterexample: a higher target with no new information (hypothetical)
Suppose a stock rises sharply after an earnings release. An analyst then raises the target because the old target has been overtaken, and leaves the earnings estimates and the rating unchanged. The target is higher, but the revision may be a catch-up to the price or a change in the valuation multiple, not a new discovery about the business. The opposite can happen too: a target stays put while the analyst lowers estimates and the multiple. Direction alone is a weak signal. Method, horizon, the estimate path and the starting price carry the information.
Hypothetical performance disclosure: This calculation is hypothetical and for educational purposes only. Hypothetical results have inherent limitations, are prepared with hindsight, involve no financial risk, and do not represent actual trading. Actual results will vary. No representation is made that any account will achieve similar profits or losses.
What time frame does an analyst price target cover, and what price is it compared with?
A target needs a clock and a reference price. Sources disagree on the usual clock, from six months to a year and a half, so the report's own wording is the only reliable one:
| Source | What it says about the horizon |
|---|---|
| The Globe and Mail | The period is "usually a year or 18 months" |
| Longbridge (a brokerage) | A stated horizon, "often 6 to 12 months" |
| FINRA Rule 2241 | A firm that uses ratings must define each one "including the time horizon and any benchmarks on which a rating is based" |
The FINRA row covers ratings. The rule text asks for a time horizon only in rating definitions, so if a report does not state one for its target, record that gap rather than assume 12 months.
How do you calculate the implied gap?
Record the inputs first: the target, the comparison price and the date of each. Then calculate the mechanical gap:
Implied gap = (target − comparison price) ÷ comparison price
Label the result a mathematical comparison, not expected performance. Longbridge lists "Upside to Price Target equals expected return" among common misconceptions and notes that "Upside is not probability-weighted" (Longbridge).
Worked example (hypothetical)
Take a hypothetical target that moves from $100 to $110 while the stock moves from $80 to $108. The arithmetic below is ours, from those assumed figures, and Longbridge's caution that upside is not expected return applies to every row:
| Measure | Calculation | Result |
|---|---|---|
| Change in the target | ($110 − $100) ÷ $100 | +10.0% |
| Gap before: old target vs old price | ($100 − $80) ÷ $80 | 25.0% |
| Gap after: new target vs new price | ($110 − $108) ÷ $108 | about 1.9% |
The headline says the target rose 10.0%. The stock rose 35.0% over the same stretch ($80 to $108), so the remaining gap fell from 25.0% to about 1.9% (our arithmetic). Same analyst, same direction, a very different picture. Whether the new target is catching up to the price or the price has run ahead of the analyst is a question for the report, not for the arithmetic.
Hypothetical performance disclosure: This calculation is hypothetical and for educational purposes only. Hypothetical results have inherent limitations, are prepared with hindsight, involve no financial risk, and do not represent actual trading. Actual results will vary. No representation is made that any account will achieve similar profits or losses.
How do analysts calculate a price target, and what assumptions drive it?
Which method is behind the number?
Most targets start from an earnings estimate and a valuation multiple. The Globe and Mail describes the usual approach as "estimating a company's future per-share earnings, and then applying a price-to-earnings multiple to that number" (The Globe and Mail). Longbridge gives the same structure, "forward EPS × chosen P/E multiple", and warns that the chosen multiple "can embed optimism or pessimism" about growth, risk and market conditions (Longbridge). Discounted cash flow and sum-of-the-parts are other methods Longbridge lists.
Which parts are public facts, and which are assumptions?
Separate what the company has reported from what the analyst assumes. The SEC points investors to "the quarterly and annual reports filed with the SEC" for their own research (SEC). The latest Form 10-K, Form 10-Q, Form 8-K or earnings release is where the reported side lives.
| Public fact (check the filing) | Analyst assumption or inference |
|---|---|
| Reported revenue, operating income, cash, debt or another disclosed metric | Forecast revenue growth, margin recovery, market share or product adoption |
| Company guidance, if provided | The analyst's adjustment to guidance or estimates |
| An announced acquisition, divestiture, buyback authorization or regulatory event | Estimated effect on earnings, cash flow or valuation |
| Current share count and capital structure from filings | The valuation multiple, discount rate or per-share bridge |
How sensitive is a target to its inputs?
Test sensitivity. Using the multiples structure Longbridge describes with hypothetical inputs, a forward EPS estimate of $4.00 at a P/E multiple of 20 gives a target of $80.00 (our arithmetic). The target falls by the same 10.0% whether the multiple drops two turns or the EPS estimate is cut by 10%, and a headline will not tell you which:
| Case (hypothetical) | Forward EPS | P/E multiple | Target | Change vs base case |
|---|---|---|---|---|
| Base case | $4.00 | 20 | $80.00 | n/a |
| Multiple falls to 18 | $4.00 | 18 | $72.00 | −10.0% |
| EPS estimate cut 10% | $3.60 | 20 | $72.00 | −10.0% |
| Both | $3.60 | 18 | $64.80 | −19.0% |
Hypothetical performance disclosure: This calculation is hypothetical and for educational purposes only. Hypothetical results have inherent limitations, are prepared with hindsight, involve no financial risk, and do not represent actual trading. Actual results will vary. No representation is made that any account will achieve similar profits or losses.
If the P/E multiple is new to you, our P/E ratio guide covers the formula and common mistakes. Ask the same question of any report: which input moved, and does a filing or the earnings release support it?
Where do you find an analyst's disclosures and target history?
What does Rule 2241 require a report to show?
In the full research report, not the headline. FINRA Rule 2241 spells out what a member firm's report has to carry. The table maps each question to the rule paragraph and quotes FINRA's wording (FINRA Rule 2241):
| Question | Rule 2241 paragraph | What the rule asks for |
|---|---|---|
| What supports the target, and what could go wrong? | (c)(1)(B) | Policies so that a target has a reasonable basis, a clear explanation of the valuation method and a fair presentation of the risks |
| What does each rating mean, over what horizon? | (c)(2) | A definition of each rating, including its time horizon and any benchmarks |
| How are the firm's ratings spread? | (c)(2)(A) | The share of all the firm's rated securities that would get a buy, hold or sell rating |
| How have the firm's targets changed? | (c)(3) | A line graph of daily closing prices that marks the date each rating or price target was assigned or changed, once the firm has had one on the security for at least one year |
| What conflicts exist? | (c)(4) | The analyst's or household's financial interest, investment-banking compensation and any market making in the stock |
| Where are the disclosures? | (c)(6) | On the front page of the report, or a front-page pointer to where they are |
The rule is written for FINRA member firms (it opens "A member must establish, maintain and enforce written policies and procedures"), so check whether the firm behind a target is one. Investor.gov gives the plain-English version. Analysts "must divulge" whether they or their firm hold a financial position in a recommended security, and "must disclose in a research report" whether their firm makes a market in it or has an investment banking relationship with the company.
Why does the analyst's employer matter?
Who the analyst works for adds context. The SEC separates sell-side analysts, who typically work for broker-dealers, from buy-side analysts and independent analysts, who "often sell their research reports on a subscription or other basis" (SEC). It adds that a conflict of interest "does not mean that his or her recommendation is flawed or unwise", only that it is a fact to weigh. To check ownership interests yourself, the SEC points to Schedules 13D and 13G and Forms 3, 4 and 5. Our guide to reading SEC Form 4 covers one of them.
How old is the guidance you are reading?
Check the date on any guidance you rely on. The SEC publication was last reviewed in August 2010 and describes the NYSE and FINRA analyst rules the SEC approved in 2002. FINRA's rulebook page shows Rule 2241 as adopted in 2015 and amended in 2019 (FINRA).
Are analyst price targets accurate?
How often were targets met?
Researchers test targets against what the stock did next. The answer changes with the sample years and with what counts as "met":
| Source | Sample | What "met" means | Result |
|---|---|---|---|
| Bradshaw and Brown working paper, April 2005 | 95,852 twelve-month targets, 1997 to 2002 | Price at or above the target at the 12-month mark; or on at least one day within the 12 months | 24%; 45% |
| Bradshaw, Brown and Huang, 2013 | Twelve-month targets, 2000 to 2009 | At the end of the 12 months; at some time during the 12 months | 38%; 64% |
| Asquith, Mikhail and Au, NBER 2002 | Not stated in the abstract | Not stated in the abstract | "slightly over 50%" |
We read the 2005 working paper in full. For the 2013 study and the 2002 NBER paper we read only the abstracts, so their figures are as the authors summarize them. Three points stand out:
- One question, several answers. Ending above a target at month 12 is a harder test than touching it once, which is why a single study reports both 38% and 64% for the same targets (Bradshaw, Brown and Huang).
- Targets ran above prices. In the 1997 to 2002 sample the mean target was 1.35 times the price three days before it was issued (Bradshaw and Brown). In the 2000 to 2009 sample, implied target-based returns exceeded actual returns by an average of 15% (Bradshaw, Brown and Huang).
- A good record did not carry over. The 2013 paper found "statistically significant but economically weak evidence of persistent differential abilities" among analysts, so one analyst's past hits are thin evidence about the next target (Bradshaw, Brown and Huang).
Does the size of the gap matter?
In the 1997 to 2002 working-paper sample, the further a target sat above the price at issue, the less often it was met (Bradshaw and Brown):
| Fifth of targets, by size of gap | Mean target-to-price ratio | Gap above price at issue (our arithmetic: ratio − 1) | Met at the 12-month mark | Met on at least one day |
|---|---|---|---|---|
| Smallest gap | 1.01 | 1% | 41% | 72% |
| Second | 1.16 | 16% | 32% | 54% |
| Third | 1.26 | 26% | 23% | 44% |
| Fourth | 1.41 | 41% | 16% | 34% |
| Largest gap | 1.90 | 90% | 7% | 21% |
| All targets | 1.35 | 35% | 24% | 45% |
These are measurements of old targets, not a rule for choosing stocks, and no study we reviewed covers targets issued in 2026. They are a reminder that the gap quoted in a headline is itself a number to question.
How do you check an analyst price target in five minutes?
- Save the headline and its timestamp, then open the original research source rather than a rewrite of it.
- Fill in the target, rating, timing and scope table from "What should you record about a target change?" above.
- Note the horizon and the comparison price with its date, then calculate the implied gap as a mechanical figure.
- Match the reported figures in the latest filing to the report's inputs, and write down the valuation method and its two or three key assumptions.
- Read the rating definitions, the rating mix and the conflicts.
Then end with two sentences: "The public facts are..." and "My inference is...". If you cannot write the first without the headline, stop.
Take your time. A January 2021 SEC investor alert about short-term trading driven by social media says "Never feel pressured to invest right away" (Investor.gov). The alert is about social media, not analyst research, so applying its caution to a price-target headline is our reading. For the wider routine around a stock, see our stock research checklist.
Where can you see analyst ratings next to the rest of a stock's data?
A firm's own report is the primary document for a target's horizon, method and disclosures. Ratings tables and terminals collect ratings in one place for convenience. FINRA's definition of a research report leaves out "statistical summaries of multiple companies' financial data, including listings of current ratings" (FINRA Rule 2241), so a ratings list is not itself required to carry a report's disclosures.
Market Terminal sells a research terminal. Its homepage describes a Stock Summary page, "Everything About A Stock In One View," with panels including Price Chart, Financials, Institutional Activity, Insider Trades, Congress Activity, Analyst Ratings and MT Ratings (Market Terminal homepage). Whatever tool you use, go back to the original report for the horizon, the method and the disclosures.
The bottom line
An analyst price target is an estimate with a clock, a method and a conflict-of-interest context. It is not a verified event. Before reading a raised or cut target as news, check what changed, the horizon and comparison price, the public facts and assumptions behind it, and the disclosures and target history. Published studies found 24% to 64% of twelve-month targets were met depending on the test (Bradshaw and Brown; Bradshaw, Brown and Huang), so one target is a starting point for research, not a conclusion.
Institutions, Insiders & Congress Intel. Track Institutional Positions, Insider Buy/Sell Transactions, And Congressional Trades.
Frequently asked questions
Is an analyst price target a forecast or a recommendation?
Neither on its own. It is the analyst's estimate under stated assumptions, not a promise and not advice tailored to you. The SEC says analysts "do not function as your financial adviser when they make recommendations" (SEC). Researchers do test targets against later prices and found 24% to 64% were met, depending on the test (Bradshaw and Brown; Bradshaw, Brown and Huang).
What time frame does an analyst price target cover?
It varies by source and by firm. The Globe and Mail says "usually a year or 18 months" (The Globe and Mail), and Longbridge says "often 6 to 12 months" (Longbridge). FINRA Rule 2241 requires a firm's rating definitions to include the time horizon (FINRA), so look in the report.
Can a stock move when an analyst changes a target even though nothing changed at the company?
Yes. The SEC says the mere mention of a company by a popular analyst "can temporarily cause its stock to rise or fall—even when nothing about the company's prospects or fundamentals has recently changed" (SEC).
Do analysts have to disclose conflicts of interest?
Generally yes. Investor.gov says "Analysts are generally required to disclose possible conflicts of interest when they recommend the purchase or sale of a specific security" (Investor.gov). Rule 2241(c)(4) lists the disclosures a FINRA member firm's report must carry (FINRA).
Where can you see a firm's past target changes?
In the research report, once the firm has had a rating or target on the stock for at least one year. Rule 2241(c)(3) requires a line graph of daily closing prices that marks the dates each rating or price target was assigned or changed (FINRA).
How often are analyst price targets met?
Studies range from 24% to 64%. One working paper found 24% met at the 12-month mark and 45% met on at least one day within the year (Bradshaw and Brown). A later study found 38% and 64% on the same two tests (Bradshaw, Brown and Huang).
Sources
- SEC, "Analyzing Analyst Recommendations" (last reviewed August 2010)
- FINRA, "2241. Research Analysts and Research Reports"
- Investor.gov, "Securities Analyst Recommendations"
- Investor.gov, "Investor Alert: Thinking About Investing in the Latest Hot Stock? Understand the Significant Risks of Short-Term Trading Based on Social Media" (January 29, 2021)
- Bradshaw and Brown, "Do Sell-Side Analysts Exhibit Differential Target Price Forecasting Ability?" (working paper, April 2005)
- Bradshaw, Brown and Huang, "Do Sell-Side Analysts Exhibit Differential Target Price Forecasting Ability?" (SSRN abstract; Review of Accounting Studies, 2013)
- Asquith, Mikhail and Au, "Information Content of Equity Analyst Reports" (NBER Working Paper 9246, 2002)
- Longbridge, "Price Target: Analyst Targets and Valuation Signals" (a brokerage's learning page, updated April 8, 2026)
- The Globe and Mail, "Stock price targets: What analysts won't tell you"
- Market Terminal homepage (features and pricing)
Related research guides
- Stock Research Checklist: 9 Steps for Better Due Diligence
- P/E Ratio Explained: Formula, Examples, and Common Mistakes
- How to Use an Earnings Calendar Before and After Results
- How to Read SEC Form 4: Insider Filings Explained
Risk disclosure. Trading and investing involve substantial risk of loss and are not suitable for everyone. Results shown are not typical; individual results vary. Many traders experience losses. Never trade with money you can't afford to lose.
Market Terminal Research