Guides
False Breakout: How to Tell a Real Break From a Fakeout
A false breakout is a move through support or resistance that does not hold: Fidelity defines it as a breakout in which "price breaks out but almost immediately returns back through its breakout price", and a failed breakout (a "trap") as one where the price then breaks out the opposite way (Fidelity, Identifying Chart Patterns). Traders call the upside version a bull trap.
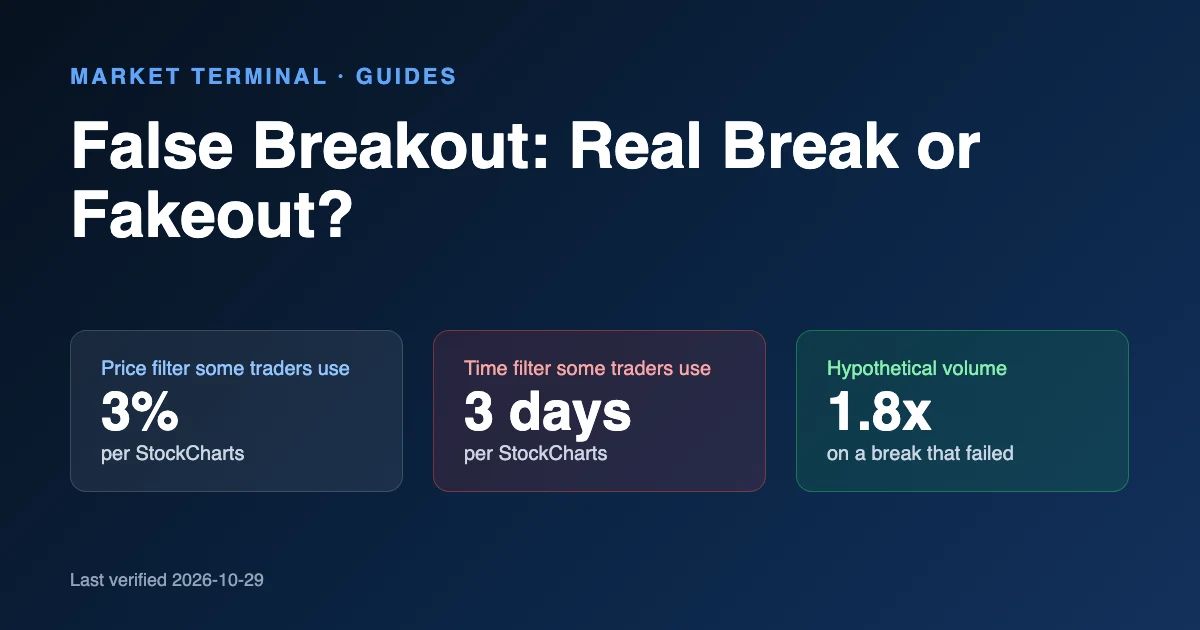
You cannot know in advance whether a breakout will hold. You can only decide in advance what would confirm the move and what would cancel it. StockCharts' ChartSchool says a break "should be on a closing basis for it to be considered valid", and that some traders add a price filter (a "3% break") or a time filter ("sustained for 3 days") (StockCharts ChartSchool). This guide shows how those filters disagree on the same chart, and how to write a rule you can check afterwards.
See breakouts as they happen. Market Terminal lets you See Breakouts In Real-Time. Treat each one as a research lead, then test it against the close, filter and volume rules you wrote down before the break.
Educational note: Educational content only — not investment advice. No earnings claims are being made, any results shown are not typical, and no investment advice is being given. Trading involves substantial risk of loss. Past performance does not guarantee future results. Examples are selected for education and don't represent typical results. We provide screening and charting tools and general market research, not recommendations to buy or sell any security.
How we researched this: the Market Terminal research team read Fidelity's chart-pattern course and its transcript, StockCharts' ChartSchool and three StockCharts articles on failed breakouts, a CMT Association note by Louise Yamada, Charles Schwab's volume guides, and SEC, Investor.gov and FINRA pages on halts and extended-hours trading, all on October 29, 2026. The worked example is hypothetical; its prices and volumes are invented and every figure from it is our own arithmetic.
Key Takeaways
- A false breakout returns through the breakout level soon after the break; a failed breakout (a bull or bear trap) then breaks the other way, per Fidelity.
- A break "should be on a closing basis", according to StockCharts; an intraday poke above resistance that closes back below is not a breakout under that rule.
- Price filters (such as a 3% break) and time filters (such as 3 days) are conventions some traders use, not proven thresholds, and they can classify the same move differently.
- Volume helps: Schwab says a breakout is "generally believed to be more significant" on above-average volume, but heavy volume does not stop a reversal.
- Write the rule before the break. Deciding afterwards turns hindsight into a signal.
Table of contents
- What is a false breakout?
- Why do false breakouts happen?
- How do you spot a false breakout?
- Same chart, four rules: a hypothetical example
- What happens after a false breakout?
- What is a breakout retest, and does it confirm the move?
- When does a breakout tell you little?
- A false breakout checklist
- The bottom line
- Frequently asked questions
What is a false breakout?
A false breakout is a price move beyond a defined level that fails to stay there. Fidelity's course separates two cases (Fidelity):
| Term | Fidelity's definition | What it looks like above resistance |
|---|---|---|
| False breakout | "Price breaks out but almost immediately returns back through its breakout price." | Price clears resistance, then closes back below it |
| Failed breakout (trap) | "False breakout occurs and the price then breaks out in the opposite direction." | Price falls back through resistance and then below support |
In Fidelity's webinar on the same slides, the presenter calls it "the concept of the false break or the failed breakout" and adds that this is where the nicknames "bull trap" and "bear trap" come from (Fidelity webinar transcript). John Bollinger's name for the same event is the "head fake": "price fakes a breakout on one side, then quickly reverses and runs the other way" (StockCharts).
This article is about judging a move after it crosses a level. Finding candidates before they break is a different job, covered in our guide to finding breakout stocks with volume.
Why do false breakouts happen?
None of the sources we read can prove why a particular breakout fails, and a chart cannot show who was buying. The explanations they offer are mechanisms, not measurements:
- Trapped late buyers. Martin Pring writes that "a sudden reversal traps late-stage buyers at the highs", and that their forced selling "rapidly fuels downward momentum" (StockCharts, Pring).
- Large sellers using the break. StockCharts' Tom Bowley says that if he had to unload a large block, "a false breakout would be one way to do it", and he stresses that this is his speculation, not fact (StockCharts, Bowley).
- No follow-through. Louise Yamada describes false breakouts as cases "in which a breakout occurs without upward (or downward) follow-through" (CMT Association).
- Thin trading outside the regular session. FINRA notes that extended-hours trading "is less liquid" and "often more volatile" (FINRA). A break that only exists in pre-market prices has had less of a test.
How do you spot a false breakout?
Fidelity lists five types of confirmation filter: "Intrabar", "Multiple closes", "Time", "Percentage or point" and "Money" (Fidelity). Each one answers a different question, so pick them before the break and write them down.
1. Did it close above the level, or only trade above it?
An intraday move above resistance is a test, not a breakout, under the closing-basis rule (StockCharts ChartSchool). Bowley's Starbucks example shows the difference: "Intraday, we had the breakout. By the close, however, it had evaporated" (StockCharts, Bowley).
Historical price movement shown for educational purposes only. Not member performance, a recommendation, or a guarantee. Most setups fail. Past performance does not guarantee future results.
Use the regular-session close. FINRA puts regular trading hours at 9:30 a.m. to 4 p.m. ET, with pre-market typically 7 to 9:30 a.m. and after-hours 4 to 8 p.m. (FINRA).
2. Is the close far enough above the level?
A percentage filter asks for a margin beyond the level, such as the "3% break" StockCharts mentions (ChartSchool). It screens out one-cent pokes, but it confirms later and can miss a move that holds without ever going far.
3. Did it stay above the level long enough?
A time filter asks for the break to be "sustained for 3 days" or some other window you choose in advance (ChartSchool). The window is a convention. Changing it after you see the chart defeats the purpose.
4. Was volume above the stock's normal level?
Schwab says that when price breaks through resistance, "the breakout is generally believed to be more significant if volume is high or above average", and that "a breakout accompanied by low volume suggests enthusiasm for the move may be lacking" (Schwab). Compare the break day with the stock's own baseline, such as the median of the prior 20 sessions. Our breakout volume guide shows how to compare volume fairly. Heavy volume on the break is supporting evidence; the worked example below shows a break on 1.8 times normal volume that still fails.
5. Do momentum and the wider market agree?
Bowley singles out "a negative divergence on a chart, followed by a reversing candle (false breakout)" as a short-term warning sign (StockCharts, Bowley). Pring checks breadth too: when the Dow hit a new high, his breadth gauge "barely climbed above its 50% equilibrium level", which he read as weak participation (StockCharts, Pring). For a single stock, compare it with its sector and the market; our guides to relative strength and market breadth cover the formulas.
Same chart, four rules: a hypothetical example
The filters above can disagree. Here is one hypothetical stock, with invented prices and volumes, run through four rules written before the break (all figures are our arithmetic; the 3% and 3-day filters come from ChartSchool). Resistance is a zone from $41.90 to $42.30, and the median volume over the prior 20 sessions is 1,250,000 shares.
| Session | Low | High | Close | Volume | Volume vs median |
|---|---|---|---|---|---|
| Day 0 (break) | $41.95 | $43.40 | $42.85 | 2,250,000 | 1.80× |
| Day 1 | $42.10 | $43.10 | $42.55 | 1,400,000 | 1.12× |
| Day 2 | $41.20 | $42.40 | $41.60 | 1,900,000 | 1.52× |
How each written rule reads it (our arithmetic):
| Rule written in advance | Day 0 | Day 1 | Day 2 | Verdict |
|---|---|---|---|---|
| R1: one close above $42.30 | Close $42.85, $0.55 (1.30%) above | — | — | "Breakout" on Day 0 |
| R2: close 3% above $42.30, i.e. at or above $43.57 | No ($42.85) | No ($42.55) | No ($41.60) | Never confirmed; no high reached $43.57 either |
| R3: break-day volume at least 1.5× median | Yes (1.80×) | — | — | Supports the break |
| R4: every close above $42.30 for 3 sessions | Above | Above (low $42.10 tested the zone) | Below ($41.60) | False breakout on Day 2 |
On Day 1 the stock traded back into the zone and closed above its top: a retest that held, for one day. On Day 2 it closed $0.70 below the zone top, 1.65% under it, on 1.52 times median volume (our arithmetic). Under rules R1 and R3 alone it looked like a high-volume breakout. Under R4 it was a false breakout, and under R2 it was never a breakout at all. The rule decides the label, which is why it has to be fixed before the move.
Hypothetical performance disclosure: This calculation is hypothetical and for educational purposes only. Hypothetical results have inherent limitations, are prepared with hindsight, involve no financial risk, and do not represent actual trading. Actual results will vary. No representation is made that any account will achieve similar profits or losses.
What happens after a false breakout?
According to Pring, a failed breakout usually resolves one of two ways: the price "quickly regroups and surges back above resistance", or, if the failure is genuine, "it usually triggers a meaningful market decline" (StockCharts, Pring). He also says a false breakout "should never be viewed in isolation" and wants a trendline break or moving-average crossover as confirmation before turning bearish.
Fidelity's webinar makes the same point from the other side. Two setups "can start exactly the same essentially. What makes them different is what happened next", and "invalidation of your entry should logically trigger the exit scenario" (Fidelity transcript). Fidelity's course suggests placing a protective stop "outside breakout bar opposite from breakout direction" (Fidelity).
What is a breakout retest, and does it confirm the move?
A retest is the price coming back to the old resistance after the break. Fidelity calls this a "throwback (on breakout up)" and notes that retracements "don't always occur" (Fidelity). ChartSchool says price "sometimes returns" to the breakout area "before resuming in the direction of the breakout" (ChartSchool).
A retest that holds is consistent with the break, not proof of it. In the hypothetical example, the Day 1 retest held and the Day 2 close still failed.
When does a breakout tell you little?
Some conditions break the comparison itself:
- Trading halts. Under the Limit Up-Limit Down rules, if a stock's price leaves its band "for more than 15 seconds, trading in the stock will be paused for five minutes" (Investor.gov). The band is set around "the average price of the stock over the immediately preceding five-minute trading period", so a halt can interrupt a break mid-move.
- Extended-hours gaps. Fidelity's webinar shows a break that came "not from trading throughout the regular trading session, but from the overnight move", followed days later by the "false breakout, or trap" (Fidelity transcript).
- News-driven spikes. A breakout on an earnings day is a reaction to new information, so check the earnings calendar before reading the chart.
- Patterns prone to false breaks. Fidelity's course flags trading ranges and triangles bounded by trend lines as patterns with "many false breakouts" (Fidelity).
The SEC also warns that "short-term investing in a volatile market carries significant risk of loss" (Investor.gov).
A false breakout checklist
Fill this in before the break and again after your window ends:
| Question | Your answer |
|---|---|
| Resistance zone (low and high) and how it was defined | |
| Closing basis: regular session only? | |
| Price filter (e.g. none, 1%, 3%) | |
| Time filter (number of sessions) | |
| Volume baseline (e.g. 20-session median) and threshold | |
| Market and sector direction on the break day | |
| Any halt, gap, earnings release or extended-hours move? | |
| What counts as a false breakout (e.g. a close back below the zone top) | |
| Result after the window: held, retest held, false, or unresolved |
"Unresolved" is a valid answer. It is better than a confident label that the rule does not support.
The bottom line
A false breakout is a break through a level that returns through it soon after. You can't know in advance whether a breakout will hold; you can fix the rule before the break: closing basis, a price or time filter, a volume baseline and a definition of failure. Then record what happened. The same chart can be a breakout under one rule and a false breakout under another, so the rule matters more than the label.
Put your breakout rules in a research process. Review breakouts in real time, build candidate lists in the Real-Time Screener, and record the rule behind every breakout you label. Free Trial For 2 Weeks • Cancel Anytime.
Frequently asked questions
What is a false breakout in stocks?
A move through support or resistance that does not hold. Fidelity defines it as a breakout where "price breaks out but almost immediately returns back through its breakout price" (Fidelity).
Is a false breakout the same as a bull trap?
Close. Fidelity's webinar links the "false break or the failed breakout" to the nicknames "bull trap" and "bear trap" (Fidelity transcript). Its course reserves "trap" for a failed breakout, where price then breaks the other way.
How many days confirm a breakout?
There is no standard. StockCharts mentions a time filter of "sustained for 3 days" as one some traders use, alongside a closing-basis rule and a "3% break" price filter (ChartSchool). Choose the window before the break.
Does high volume prevent a false breakout?
No. Above-average volume makes a breakout "generally believed to be more significant", per Schwab, but it does not stop a reversal. In our hypothetical example, a break on 1.8 times median volume still failed two sessions later.
What is the difference between a false breakout and a failed breakout?
In Fidelity's terms, a false breakout returns through the breakout level; a failed breakout returns through it and then breaks out in the opposite direction (Fidelity).
Sources
- Fidelity, "Identifying Chart Patterns with Technical Analysis" (course PDF)
- Fidelity, "Chart Patterns" webinar transcript (PDF)
- StockCharts ChartSchool, "Symmetrical Triangle" (StockCharts sells charting software)
- StockCharts, Martin Pring, "Breakout or Breakdown? Why Last Week's Rally Raises Red Flags"
- StockCharts, Tom Bowley, "Breakouts: Deciphering the Good from the Bad"
- StockCharts Insider, "How to Spot a Stock That's Wound Tight and Ready to Break, Part 1"
- CMT Association, Louise Yamada, "Anatomy of a Top: Seven Questions"
- Charles Schwab, "Trading Volume as a Market Indicator"
- FINRA, "Extended-Hours Trading: Know the Risks"
- Investor.gov, "Thinking About Investing in the Latest Hot Stock?"
Related research guides
- How to Find Breakout Stocks: A 7-Step Volume Guide
- Cup and Handle Pattern: Rules, Targets and Real Odds
- Relative Strength vs. RSI: The Difference, Formulas, and Proper Use
- Stock Market Breadth: Indicators, Formulas, and a Practical Workflow
- How to Use an Earnings Calendar Before and After Results
Risk disclosure. Trading and investing involve substantial risk of loss and are not suitable for everyone. Results shown are not typical; individual results vary. Many traders experience losses. Never trade with money you can't afford to lose.
Market Terminal Research