Guides
Cup and Handle Pattern: Rules, Targets and Real Odds
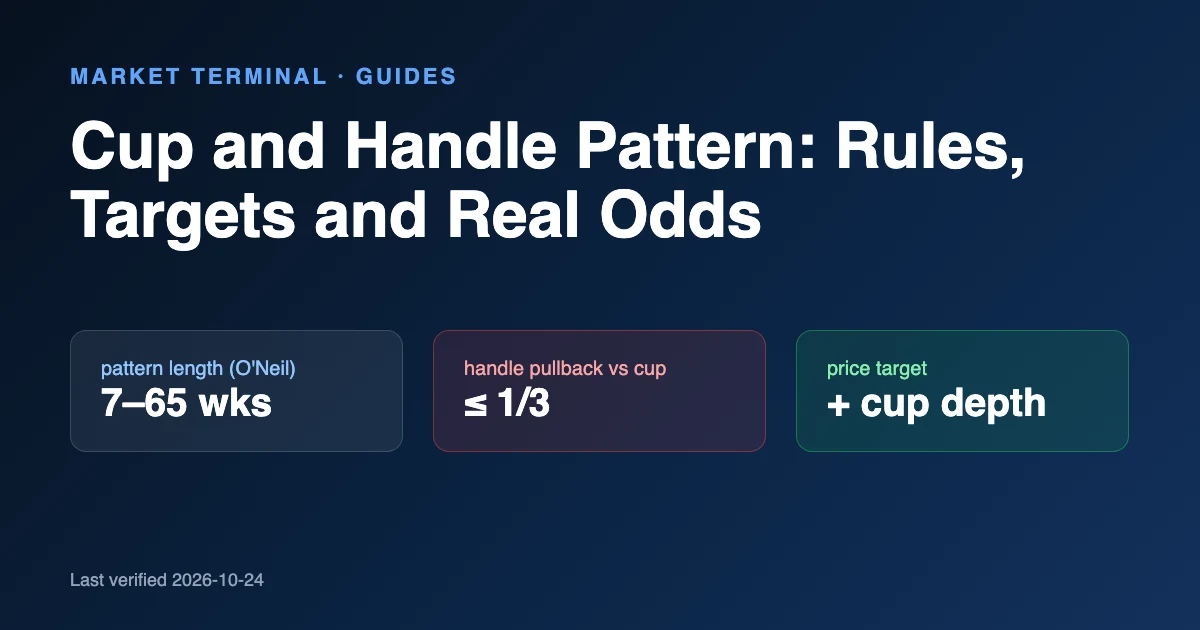
A cup and handle is a bullish continuation chart pattern: a rounded, U-shaped drop and recovery (the cup), followed by a shorter, shallower pullback (the handle), that resolves when price breaks above the handle's high. William J. O'Neil defined it in his 1988 book How to Make Money in Stocks, and it typically forms over seven to 65 weeks (Investopedia).
The standard trade plan is a buy just above the handle high, a stop below the handle low, and a target equal to the cup's depth added to the breakout price. The numbers most guides quote for "how deep" and "how long" disagree because they come from different rule sets and use different baselines. This guide shows whose rule is whose.
Watch breakouts as they happen with Market Terminal. See stocks breaking out in real time, then check each one's chart, volume and relative strength before drawing a conclusion.
Educational note: Educational content only — not investment advice. No earnings claims are being made, any results shown are not typical, and no investment advice is being given. Trading involves substantial risk of loss. Past performance does not guarantee future results. Examples are selected for education and don't represent typical results. We provide screening and charting tools and general market research, not recommendations to buy or sell any security.
How we researched this: the Market Terminal research team read the 10 pages that rank for "cup and handle pattern", Investopedia, Fidelity and Wikipedia's entries, and three Reddit threads where traders discuss the pattern, all on October 24, 2026. Worked examples and their arithmetic are our own and are hypothetical.
Key Takeaways
- A cup and handle is a bullish continuation pattern: it needs a prior uptrend, a rounded cup and a short handle on lighter volume.
- Durations: O'Neil puts the whole pattern at 7 to 65 weeks; Fidelity and Wikipedia put the cup at 1 to 6 months and the handle at 1 to 4 weeks.
- The handle should retrace no more than about one-third of the cup; below half the cup, the pattern is usually treated as broken.
- Entry is just above the handle high, the stop just below the handle low, and the target is the cup depth added to the breakout.
- None of the ranking guides we reviewed cites a primary study of its success rate, so treat any "70% win rate" claim with caution and test it on your own markets.
Table of contents
- What is a cup and handle pattern?
- What are the cup and handle rules, and whose rules are they?
- How deep should the cup and the handle be?
- How do you know it's not a cup and handle?
- Where do you enter, and where do you put the stop?
- How do you calculate the cup and handle target?
- How reliable is the cup and handle pattern?
- Does it work on intraday charts?
- What is an inverted cup and handle?
- The bottom line
- Frequently asked questions
What is a cup and handle pattern?
A cup and handle is a price base that forms after a stock has already risen. Sellers push the price down from a high, buyers absorb the selling in a rounded bottom, and the price climbs back to near the old high. That is the cup. A brief pullback near the old high, as holders who bought at the top sell out, forms the handle. When the price clears the handle high, the base is complete.
Three features separate a real cup and handle from a random U-shape:
- A prior uptrend. The pattern is a pause in a rising stock, not a bottom after a long decline. Morpheus Trading, for example, wants the price "at least 30-40% above the 52-week low BEFORE the cup develops" (Morpheus Trading).
- A rounded "U", not a sharp "V". Investopedia describes the pattern as "characterized by a 'U' shaped cup followed by a downward sloping handle" (Investopedia).
- A short handle near the old high, then a breakout on heavy volume, "preferably 50%-100% higher than average volume" (Get Together Finance).
What are the cup and handle rules, and whose rules are they?
Most guides list the same rules with different numbers and no attribution. The table below puts each source's numbers side by side.
| Rule | O'Neil, via Investopedia | Fidelity | Wikipedia | Morpheus Trading (swing-trading newsletter) |
|---|---|---|---|---|
| Whole pattern | 7–65 weeks | — | a few weeks to a few years | cup at least 7 weeks |
| Cup duration | — | 1–6 months, occasionally longer | commonly 1–6 months | — |
| Handle duration | 4 days to 4 weeks | 1–4 weeks | 1–4 weeks | ideally 3–4 weeks, at least 5 days |
| Cup depth | — | — | — | 20–35% below the prior high; 40–49% is too deep |
| Handle pullback | — | up to 1/3 of the cup's advance | about 30–50% of the cup's rise | no more than 12% below the handle high; over 15% is too deep |
Sources: Investopedia, Fidelity, Wikipedia, Morpheus Trading.
The pattern was built for daily and weekly stock charts. The durations above assume those timeframes.
How deep should the cup and the handle be?
The cup is usually 20–35% off the prior high in stocks, and the handle should give back no more than about a third of the cup. Guides seem to disagree here because they measure depth in two different ways.
- Percent off the high. A cup that drops from $100 to $80 is 20% deep. Morpheus's 20–35% rule and its "handle no more than 12% below the handle high" rule use this baseline (Morpheus Trading).
- Share of a prior move. TrendSpider says the cup "is typically one-third to one-half of the prior uptrend height", and that the handle "retraces no more than one-third of the cup's height" (TrendSpider).
A hypothetical worked example using TrendSpider's own numbers, a cup from $100 down to $80 and back to $100 with a handle to $95 (our arithmetic):
| Measure | Calculation | Result | Within the rule? |
|---|---|---|---|
| Cup depth, % off the high | ($100 − $80) ÷ $100 | 20% | Yes, inside 20–35% |
| Cup depth vs a prior rise from $60 to $100 (our assumption) | $20 ÷ $40 | 50% of the uptrend | Yes, at the edge of one-third to one-half |
| Handle depth, % off the handle high | ($100 − $95) ÷ $100 | 5% | Yes, under 12% |
| Handle depth as a share of the cup | $5 ÷ $20 | 25% of the cup | Yes, under one-third |
The same handle is "5%" on one baseline and "25%" on the other. Both describe a healthy handle.
How do you know it's not a cup and handle?
The most common mistake, judging by the Reddit threads we read, is labelling any U-shape a cup and handle. Run these checks before trusting the pattern:
- No prior uptrend. If the left side of the cup is not a previous high after a rise, it is a bottoming pattern, not a continuation. Morpheus asks for a stock at least 30–40% above its 52-week low before the cup forms (Morpheus Trading).
- The handle falls into the lower half of the cup. ChartMill's rule is that "the low of the handle may not exceed 50% of the total cup distance" (ChartMill), and Fidelity puts the handle's pullback at up to a third of the cup's advance (Fidelity).
- A V-shaped cup. The pattern is defined by a rounded, "U" shaped cup (Investopedia); a sharp V is a different setup.
- The breakout comes on weak volume. A breakout should come on volume well above average, "preferably 50%-100% higher" (Get Together Finance).
- The cup is too deep. Morpheus treats 40–49% cups as too wide, because overhead supply is too heavy (Morpheus Trading).
Where do you enter, and where do you put the stop?
The usual rule is a buy stop just above the handle high and a stop just below the handle low. To avoid a bad fill when a stock gaps up, ChartMill suggests a buy stop-limit instead of a plain buy stop, for example a "buystop limit order at the price level $100.10 with a limit at $100.50" (ChartMill). A plain stop order can fill far above your level if the price "unexpectedly opens 10% higher the next day".
Volume should confirm the breakout. One guide suggests volume 50–100% above average (Get Together Finance); our guide to finding breakout stocks with volume explains how to compare volume fairly.
On the stop, Morpheus caps the loss at "not more than 7% to 10% below your entry price" (Morpheus Trading). Using the hypothetical example above (our arithmetic):
| Item | Value |
|---|---|
| Entry (buy stop-limit) | $100.10 |
| Stop, just below the $95 handle low | $94.90 |
| Risk per share | $5.20 (5.2% of entry, inside the 7–10% cap) |
| Shares at 1% risk on a hypothetical $50,000 account | $500 ÷ $5.20 ≈ 96 shares |
TrendSpider's position-sizing rule is to "never risk more than 1–2% of your total capital on one trade" (TrendSpider).
How do you calculate the cup and handle target?
Add the cup's depth to the breakout price. TrendSpider's example: a cup from $100 to $80 and back, with a breakout above $100, "could project a target near $120" (TrendSpider). A target is a measuring convention, not a forecast: many breakouts never reach it, and many fail outright.
With the hypothetical entry and stop above, a $120 target would put the distance to the target at $19.90 against a risk of $5.20, about 3.8 to 1 (our arithmetic). ChartMill notes that the rule "the low of the handle may not exceed 50% of the total cup distance" usually means at least a 2-to-1 reward-to-risk (ChartMill).
Hypothetical performance disclosure: This calculation is hypothetical and for educational purposes only. Hypothetical results have inherent limitations, are prepared with hindsight, involve no financial risk, and do not represent actual trading. Actual results will vary. No representation is made that any account will achieve similar profits or losses.
Investopedia's historical example is Wynn Resorts: the stock "broke out in October 2013 and added 90 points in the following five months" (Investopedia).
Historical price movement shown for educational purposes only. Not member performance, a recommendation, or a guarantee. Most setups fail. Past performance does not guarantee future results.
How reliable is the cup and handle pattern?
None of the ten ranking pages we reviewed on October 24, 2026 shows primary data. One broker guide states "a success rate of around 65 – 70%" and attributes it to Thomas Bulkowski, but gives no source document (Alchemy Markets). That is not an independent study, and we could not verify it.
What that means in practice:
- Treat any single "win rate" as a claim, not a fact.
- Judge each setup on its own risk and reward rather than on a claimed hit rate.
- Test the pattern on the stocks and timeframes you study before relying on it. A stock screener can pull candidates near their highs, and relative strength helps separate leaders from laggards.
Does it work on intraday charts?
The rules were written for daily and weekly stock charts, so the 7-to-65-week durations do not translate to 15-minute or other intraday charts. Traders do apply the shape there: keep the proportions (a shallow handle, a rounded cup) and expect more false breakouts. One Reddit trader in the threads we read reported better results on longer timeframes.
What is an inverted cup and handle?
An inverted cup and handle is the bearish mirror image, by common convention: a rounded top, a small bounce (the handle), and a breakdown below the handle low. The same proportions apply in reverse, with the target measured downward from the breakdown.
The bottom line
A cup and handle is a pause in an uptrend: a rounded cup, a shallow handle on light volume, and a breakout above the handle high. The usual plan puts a stop below the handle low and a measured target equal to the cup's depth. Check whose rules a guide is quoting, and test the pattern before trusting any success rate.
Put the pattern in a research workflow. Market Terminal lets you see breakouts in real time and includes a real-time screener, so you can review setups as handles clear their highs. Free trial for 2 weeks, cancel anytime.
Frequently asked questions
Is a cup and handle bullish or bearish?
It is treated as a bullish continuation pattern: it forms after a prior rise and completes when price clears the handle high. The inverted version is the bearish mirror image.
How long does a cup and handle take to form?
O'Neil's rule, via Investopedia, is 7 to 65 weeks for the whole pattern. Fidelity and Wikipedia put the cup at 1 to 6 months and the handle at 1 to 4 weeks.
How deep should the handle be?
Fidelity says up to a third of the cup's advance. Morpheus Trading uses no more than 12% below the handle high. A handle that drops into the lower half of the cup is usually treated as a failed pattern.
How do you measure the price target?
Add the cup's depth to the breakout price. A cup from $100 to $80 projects a measured target near $120 after a breakout above $100. It is a measuring convention, not a prediction.
How often does the cup and handle work?
None of the guides we reviewed cites a primary study. A broker guide quotes a 65–70% success rate without a source document, so treat it as an unverified claim.
Sources
- Investopedia, "Cup and Handle Pattern"
- Fidelity, "Cup with Handle"
- Wikipedia, "Cup and handle"
- TrendSpider, "Cup and Handle Pattern"
- ChartMill, "The cup and handle chart pattern"
- Morpheus Trading, "Cup and Handle Pattern"
- Get Together Finance, "Cup and Handle Pattern"
- Alchemy Markets, "Cup and Handle Pattern Explained"
Related research guides
- How to Find Breakout Stocks: A 7-Step Volume Guide
- Relative Strength vs. RSI: The Difference, Formulas, and Proper Use
- How to Use a Stock Screener: 7-Step Guide
- Stock Market Breadth: Indicators, Formulas, and a Practical Workflow
Risk disclosure. Trading and investing involve substantial risk of loss and are not suitable for everyone. Results shown are not typical; individual results vary. Many traders experience losses. Never trade with money you can't afford to lose.
Market Terminal Research