Guides
Relative Volume (RVOL): Formula, Thresholds, Time of Day
Relative volume (RVOL) is a ratio of trading volume to a baseline of what is normal for that stock: 1.0 means volume matches the baseline, and 2.5 means 2.5 times it (StockCharts ChartSchool). The baseline is usually an average of prior bars or sessions, and Fidelity defines average volume as "the total volume for a specified period divided by the number of bars in that same period" (Fidelity).
The formula is one line. The choices behind it are not: which volume goes on top, which average goes underneath, and whether the clock matches. A reading at 10:15 a.m. describes 45 minutes of trading, not the whole day. This guide covers the formula, how vendors define it differently, what a "good" level means and who says so, and one hypothetical example in which the same 600,000 shares produce three different ratios.
See breakouts as they happen. Market Terminal lets you See Breakouts In Real-Time and includes a Real-Time Screener. Use them to build a candidate list, then test each stock's volume against a same-time baseline.
Educational note: Educational content only — not investment advice. No earnings claims are being made, any results shown are not typical, and no investment advice is being given. Trading involves substantial risk of loss. Past performance does not guarantee future results. Examples are selected for education and don't represent typical results. We provide screening and charting tools and general market research, not recommendations to buy or sell any security.
How we researched this: on October 29, 2026, the Market Terminal research team read the StockCharts, TradingView, Webull, Schwab and Fidelity pages on relative volume, average volume and unusual-volume alerts, and the SEC, FINRA and Investor.gov pages on trading hours, and checked every quoted figure against the page cited. Market Terminal sells a research terminal; StockCharts, TradingView, Webull, Fidelity and Schwab's thinkorswim sell charting or trading products, so we name them as vendors wherever they carry a claim. Every worked example is hypothetical and the arithmetic is our own.
Key Takeaways
- Relative volume is volume divided by a baseline. 1.0 is normal for the baseline you chose, and the baseline is a choice, not a standard.
- Vendors define it differently: StockCharts compares one bar with a 50-period average by default, TradingView accumulates volume since the period start, and thinkorswim reports standard deviations.
- Early in the session the baseline must come from the same time of day. In our hypothetical, the same 600,000 shares at 10:15 a.m. read 0.6, 5.2 or 3.0 depending on the denominator.
- A 3.0 at 10:15 a.m. can finish the day near 1.4 if the rest of the session is normal (hypothetical, our arithmetic).
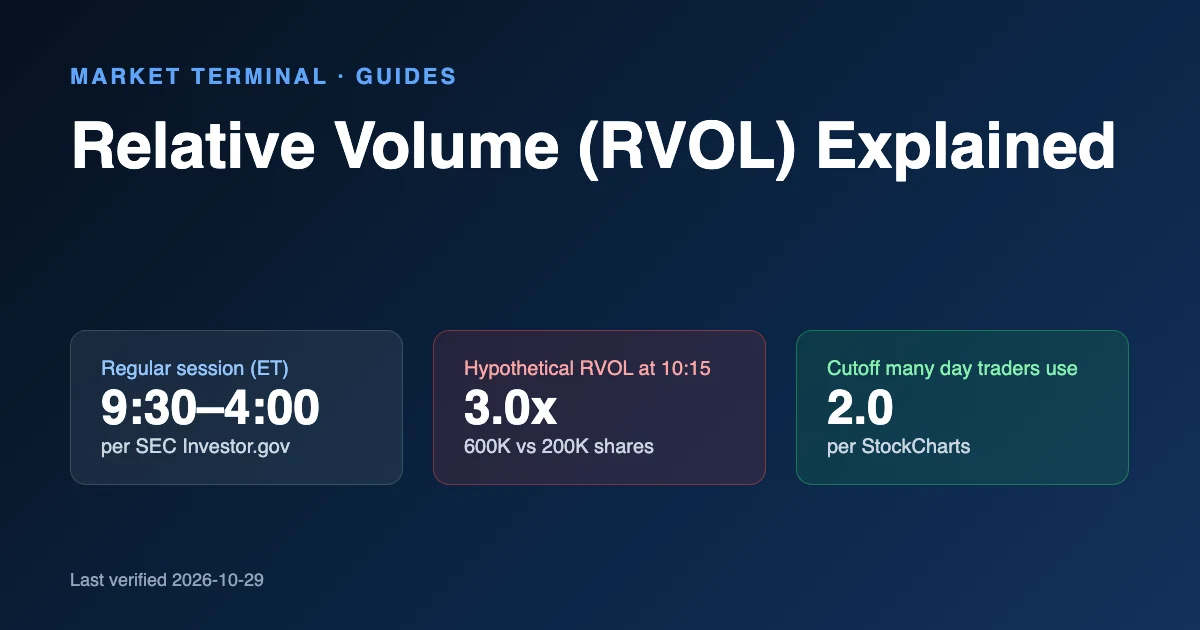
- No source sets a universal "good" level. StockCharts says many day traders look for over 2.0 and that the threshold "will be different for each investor".
Table of contents
- What is relative volume (RVOL)?
- How do you calculate relative volume?
- How does time of day change relative volume?
- What is a good relative volume?
- Do pre-market and after-hours trades count toward relative volume?
- Does high relative volume mean the price will keep rising?
- How do you use relative volume when looking for breakouts?
- The bottom line
- Frequently asked questions
What is relative volume (RVOL)?
Relative volume compares the volume traded in a period with the average volume for a comparable period. StockCharts, a charting vendor, says its RVOL indicator "compares volume data for each price bar with the average volume over a specified number of prior bars", and that a reading of 2.5 "means the volume for the current bar is 2.5 times the normal volume for the specified period" (StockCharts ChartSchool).
Volume itself is a standard field in public price history. Investor.gov says historical data gives "the opening and closing price for each day of trading, and the daily high and low price for a stock, along with trading volume" (Investor.gov). RVOL turns that raw count into a comparison:
RVOL = volume observed ÷ baseline volume for the same comparison window
Three things RVOL is not:
- Not average volume. Average volume is the denominator. Fidelity's indicator is the "Simple Moving Average of the Volume for the specified period" (Fidelity).
- Not a direction. Volume has no sign. Webull, a brokerage, writes that "High volatility doesn’t necessarily mean more buying—it can mean more selling, too" (Webull).
- Not a forecast. It describes activity so far. The 10:15 a.m. example below shows how far a morning reading can sit from the day's final total.
How do you calculate relative volume?
There is no single RVOL formula. Five documented approaches differ in what goes on top and what goes underneath:
| Version | Numerator | Baseline | Source |
|---|---|---|---|
| Daily | The current day's volume | The average day's volume, for example the past 10 days ("RVOL 10D") | Webull (brokerage) |
| Bar-level | One bar's volume | The prior bars' average, a 50-period simple moving average by default | StockCharts (charting vendor) |
| Same-time cumulative ("Relative Volume at Time") | Volume accumulated since the period start (the default mode) | The average of the same offset in earlier periods; the documentation's example uses five days | TradingView (charting platform) |
| Standardized | Bar volume | Its simple moving average, expressed in standard deviations | thinkorswim (Schwab platform) |
| Percentile alert | Trailing 30-minute volume | A threshold at the top percentile of the previous 30 trading days' volume, specific to the time of day; an alert, not a ratio | Fidelity (brokerage) |
Five approaches, five calculations. If a platform does not publish its formula, treat its RVOL as vendor-defined, and compare readings only within one definition.
What is a repeatable way to calculate it?
Write these choices down before you look at the result:
- Name the session. Regular hours run 9:30 a.m. to 4:00 p.m. Eastern Time (SEC Investor.gov). Say whether pre-market and after-hours trades are in or out.
- Name the cutoff and the bar. "Cumulative volume through 10:15" and "the 10:10 to 10:15 bar" are different numerators.
- Build the baseline from the same clock. For each prior session in a stated lookback, take volume through the same cutoff, with the same session rules. Leave today out.
- Pick mean or median, and say which. The worked example below shows how one news day moves the baseline.
- Divide, and label the result. If a vendor does not disclose its formula, call the output "vendor-defined RVOL".
- Recheck at the close. Keep both timestamps. The later reading tests persistence; it does not change what was knowable at 10:15.
How does time of day change relative volume?
Volume is not spread evenly across the session. StockCharts says "volume can be much higher at the beginning or end of the trading day than at other times of day", which is why it offers a time-of-day version of its indicator (StockCharts ChartSchool). Fidelity's methodology for its unusual-volume alerts says the historical ranges "are time-of-day specific (i.e. market open is different from mid-day, which is different from market close)" (Fidelity). Schwab says surges around the open and close are often the result of market makers rushing to fill orders (Schwab).
That is why a mid-session ratio needs a same-time baseline. TradingView's documentation notes that the current value "will be lower than it should be" while "the most recent bar is not yet closed" (TradingView). Partial data in the numerator pulls a ratio down unless the denominator is partial too.
The three examples below follow one hypothetical stock through one morning. Assume, hypothetically, that:
- its cumulative volume by 10:15 a.m. over the last ten sessions was 170,000; 180,000; 190,000; 195,000; 200,000; 200,000; 205,000; 210,000; 220,000 and 600,000 (a news day);
- it averages 1,000,000 shares over a full session;
- it has traded 600,000 shares by 10:15 a.m. today.
The regular session is 390 minutes long (6.5 hours, from the 9:30 a.m. to 4:00 p.m. hours in the SEC bulletin), and 45 minutes have elapsed. All arithmetic below is our own.
Mean or median: how does one news day move the baseline? (hypothetical)
A baseline built from a few sessions can be dragged by one unusual day. Using the ten-session series above:
| Baseline method | Calculation | Baseline | RVOL for 600,000 shares |
|---|---|---|---|
| Mean | 2,370,000 ÷ 10 sessions | 237,000 | 2.5 |
| Median | Midpoint of the fifth and sixth values (200,000 and 200,000) | 200,000 | 3.0 |
Hypothetical performance disclosure: This calculation is hypothetical and for educational purposes only. Hypothetical results have inherent limitations, are prepared with hindsight, involve no financial risk, and do not represent actual trading. Actual results will vary. No representation is made that any account will achieve similar profits or losses.
Neither is wrong. The mean keeps the news day in the baseline and lowers the ratio; the median mostly ignores it. Choose in advance, and say which you used.
The same 600,000 shares with three denominators (hypothetical)
Hold the numerator at 600,000 shares and change only the denominator:
| Denominator | Calculation | RVOL | What it really compares |
|---|---|---|---|
| Full-day average | 600,000 ÷ 1,000,000 | 0.6 | A 45-minute total with a 390-minute total |
| Straight-line share of the full-day average | 600,000 ÷ (1,000,000 × 45 ÷ 390 ≈ 115,385) | 5.2 | Assumes volume arrives evenly all day |
| Same-time median | 600,000 ÷ 200,000 | 3.0 | Like with like at 10:15 a.m. |
Hypothetical performance disclosure: This calculation is hypothetical and for educational purposes only. Hypothetical results have inherent limitations, are prepared with hindsight, involve no financial risk, and do not represent actual trading. Actual results will vary. No representation is made that any account will achieve similar profits or losses.
The first line makes a busy morning look quiet. The second makes it look extreme because it ignores the heavy volume near the open. Only the third compares the same clock with the same clock.
What can a 3.0 at 10:15 a.m. become by the close? (hypothetical)
A 3.0 is a statement about 45 minutes. A normal session leaves 1,000,000 − 200,000 = 800,000 shares still to trade after 10:15:
| Rest of the session | Shares after 10:15 | Final volume | Full-day RVOL |
|---|---|---|---|
| Half the normal remaining pace | 400,000 | 1,000,000 | 1.0 |
| Normal remaining pace | 800,000 | 1,400,000 | 1.4 |
| Double the normal remaining pace | 1,600,000 | 2,200,000 | 2.2 |
Even if the remaining 345 minutes are perfectly ordinary, the day ends at 1.4 times the full-day average, not 3.0. In the half-pace row, the morning's 3.0 finishes as an ordinary 1.0 day. The reverse happens too: a quiet open can be followed by an earnings release or other news that lifts the afternoon, and Schwab notes that announcements "could also generate volume for nontechnical reasons" (Schwab). The early reading was not wrong. It was incomplete.
Hypothetical performance disclosure: This calculation is hypothetical and for educational purposes only. Hypothetical results have inherent limitations, are prepared with hindsight, involve no financial risk, and do not represent actual trading. Actual results will vary. No representation is made that any account will achieve similar profits or losses.
What is a good relative volume?
No source we read gives one answer. StockCharts says "The threshold for “significantly” above average volume will be different for each investor". It adds that "Many day traders look for an RVOL over 2.0 before investing", and warns that "in practice anything over 4.0 is considered a volume spike and not a typical RVOL value" (StockCharts ChartSchool).
The number 2.0 shows up in more than one vendor's material, but it does not mean the same thing:
| Source | What 2.0 refers to | Baseline |
|---|---|---|
| StockCharts (charting vendor) | A ratio: "Many day traders look for an RVOL over 2.0" | One bar against a 50-period average by default |
| thinkorswim (Schwab platform) | A count of standard deviations: the histogram's bars are highlighted when the indicator value "exceeds 2.0", according to the indicator's author | Volume against its simple moving average, in standard deviations |
| Webull (brokerage) | No cutoff; RVOL 10D above 1 means volume is "higher than the average over the past 10 days" | Current day against the average day |
A ratio of 2.0 is twice the baseline. A reading of 2.0 standard deviations is a different statement, and a stock can pass one and miss the other. Webull is blunt about the limit of any level: "High relative volume never means a buy signal" (Webull). Treat a cutoff as a screening convention, test how many names it admits, and write down the lookback that goes with it.
Do pre-market and after-hours trades count toward relative volume?
It depends on the data source, so check. Regular trading hours for stocks are 9:30 a.m. to 4:00 p.m. Eastern Time, and extended-hours trading is anything outside them (SEC Investor.gov). FINRA says pre-market trading is "typically defined as taking place from 7 – 9:30 a.m. ET and after-hours trading from 4 – 8 p.m. ET" (FINRA).
Mixing sessions breaks the comparison for three reasons:
- Liquidity differs. FINRA writes that "Extended-hours trading is less liquid" (FINRA). The SEC says reduced trading interest "generally results in wider spreads between the bid and ask prices for a stock or no quotes at all" (SEC Investor.gov).
- Data differs. The SEC notes that "consolidated quote and trade data for a stock that is available during regular trading hours may not be readily available during extended-hours trading" (SEC Investor.gov).
- Both sides of the ratio must match. A regular-hours baseline divided into a number that includes pre-market trades is not like with like, and neither is the reverse.
State the session next to every ratio you record.
Does high relative volume mean the price will keep rising?
No. RVOL says how active a stock is, not who is buying or what happens next. Schwab says that "High volume can also signal the end of a trend—the final surge of buying and selling before it's completely exhausted" (Schwab). It adds that "traders should never rely on volume as the sole corroborating signal when researching a trade". StockCharts says to use its indicator with other indicators and analysis techniques, not on its own (StockCharts ChartSchool).
Consider a hypothetical stock that files an unexpected announcement at 10:12 a.m. Buying and selling surge, and the 10:15 ratio is high. By midday the news is absorbed. In the half-pace row of the table above, a morning 3.0 ends the day at 1.0. High volume described the repricing; it did not say the move would continue.
Hypothetical performance disclosure: This calculation is hypothetical and for educational purposes only. Hypothetical results have inherent limitations, are prepared with hindsight, involve no financial risk, and do not represent actual trading. Actual results will vary. No representation is made that any account will achieve similar profits or losses.
Which questions should you answer before calling volume unusual?
- Is the numerator one bar, cumulative volume, or a vendor's projection?
- Does the denominator use the same time of day, bar length, session and venue?
- How many comparable sessions are in the lookback, and are holidays and half-days handled?
- Were splits, reverse splits, offerings, halts and ticker changes checked?
- Is the news timestamp documented in a primary source, such as the company's filing or release, or inferred from price and volume?
- Is the reading saved as an "as of" observation, not rewritten after the close?
- Are you describing what happened, or quietly predicting what will happen next?
How do you use relative volume when looking for breakouts?
As one filter among several. Schwab says a breakout "is generally believed to be more significant if volume is high or above average", and that "A breakout accompanied by low volume suggests enthusiasm for the move may be lacking" (Schwab). Those statements are about confirmation, not prediction.
Our guide to finding breakout stocks with volume puts relative volume inside a seven-step workflow: universe, level, participation, relative strength, company research, failure rules and outcome review. If you set an RVOL cutoff in a screener, our stock screener guide covers how to document the filter. Do not confuse the ratio with relative strength, which compares price performance against a benchmark. And keep known report dates in mind: an earnings release can inflate the volume in a baseline, as our earnings calendar workflow explains.
The bottom line
Relative volume is volume divided by a baseline, and every part of that sentence is a choice. Match the clock, name the session, say whether you used a mean or a median, and treat any "good" level as a convention. A strong reading at 10:15 a.m. is evidence about the morning, not a forecast of the close.
Put the ratio in a research process. Build a list in the Real-Time Screener, review breakouts as they happen, and record the baseline, cutoff and session behind every relative volume reading. Free Trial For 2 Weeks • Cancel Anytime.
Frequently asked questions
What does a relative volume of 2 mean?
On a ratio basis it means volume is twice the baseline. StockCharts puts it this way: a value of 2.5 "means the volume for the current bar is 2.5 times the normal volume for the specified period" (StockCharts ChartSchool). In thinkorswim's RelativeVolumeStDev, 2.0 is a count of standard deviations instead (thinkorswim).
What is a good relative volume for day trading?
There is no standard. StockCharts says "Many day traders look for an RVOL over 2.0" and that the threshold "will be different for each investor" (StockCharts ChartSchool).
Is relative volume the same as average volume?
No. Average volume is the baseline. Fidelity defines it as "the total volume for a specified period divided by the number of bars in that same period" (Fidelity). Relative volume divides a current reading by that kind of average.
How many days should the baseline cover?
Vendors differ. StockCharts uses a 50-period average by default (StockCharts ChartSchool), Fidelity's unusual-volume alerts use 30 trading days of history (Fidelity), Webull's example is 10 days (Webull), and TradingView's documentation walks through five (TradingView). Pick a lookback, state it, and keep it fixed.
Does relative volume include pre-market trading?
Only if the data source includes it. Regular hours are 9:30 a.m. to 4:00 p.m. ET, and FINRA describes pre-market trading as typically 7 to 9:30 a.m. ET (FINRA). Record which session your ratio uses.
Can relative volume predict a breakout?
No. Schwab says a breakout is "generally believed to be more significant if volume is high or above average" (Schwab). It also says traders "should never rely on volume as the sole corroborating signal when researching a trade" (Schwab). Volume is evidence to weigh, not a forecast.
Sources
All sources below were checked on October 29, 2026.
- Fidelity, "What Is Average Volume?"
- StockCharts ChartSchool, "Relative Volume (RVOL)" (charting vendor)
- TradingView, "Relative Volume at Time" (charting platform)
- Fidelity, "Real-time Analytics Methodology" (PDF) (brokerage)
- Schwab thinkorswim Learning Center, "RelativeVolumeStDev" (trading platform)
- Webull, "Looking for an unusual trading activity?" (brokerage)
- Charles Schwab, "3 Ways Volume Can Help Confirm Price Trends"
- Charles Schwab, "Trading Volume as a Market Indicator"
- SEC Investor.gov, "Extended-Hours Trading: Investor Bulletin"
- FINRA, "Extended-Hours Trading: Know the Risks"
- Investor.gov, "Stock Quotes" glossary entry
Related research guides
- How to Find Breakout Stocks: A 7-Step Volume Guide
- Cup and Handle Pattern: Rules, Targets and Real Odds
- Stock Market Breadth: Indicators, Formulas, and a Practical Workflow
- Stock Research Checklist: 9 Steps for Better Due Diligence
- Relative Strength vs. RSI: The Difference, Formulas, and Proper Use
Risk disclosure. Trading and investing involve substantial risk of loss and are not suitable for everyone. Results shown are not typical; individual results vary. Many traders experience losses. Never trade with money you can't afford to lose.
Market Terminal Research